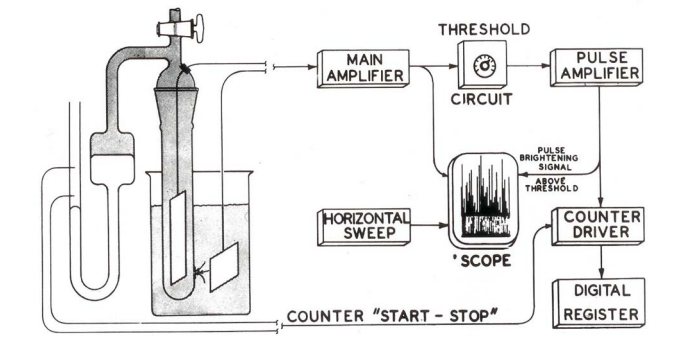
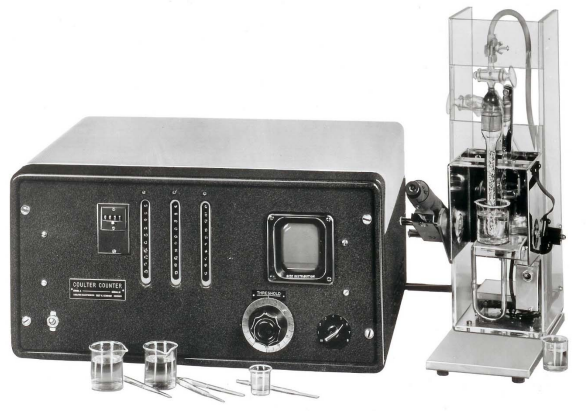
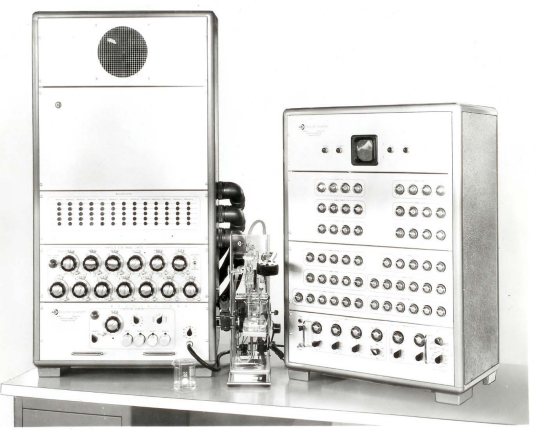
xxxxxIn October 1948 Wallace H. Coulter demonstrated that individual blood cells, when appropriately suspended in saline solution and flowed through a small aperture through which an electrical current was also flowing, could be sensed via the transient changes their throughflow produced in the current.1 Over the next several years he showed that these cellular signals could be processed electronically to provide count and volumetric data for the cells while a specific volume of the suspension flowed through the aperture (Figure 1). He then implemented his Coulter Principle in the first commercially-available automated blood-cell counter, the Coulter Counter® Model A (Figure 2), which he introduced in his presentation at the 1956 National Electronics Conference in Chicago.2 Acceptably limiting coincidental passage of multiple cells through the sensing aperture required sample dilutions yielding maximum counts of some 50,000 cells, or a cellular throughflow of about 3,300 cells per second, whereas a conventional manual count of 500 cells required perhaps 20 minutes.
xxxxxThe automated count repeatably reduced count errors to one-tenth of those for manual counts done by expert technologists, this by a method that not only required less-skilled technologists, but needed only 1.25% of the count time.4 Coulter then guided the groundbreaking Model A counter through incremental development into increasingly sophisticated automated hematology analyzers, successors to which now daily analyze millions of patients’ blood samples.5 In 1978 he became a charter member of the International Society for Analytical Cytology (ISAC), and in addition to his other recognitions, 6 in 1993 he was awarded one of the Society’s first two Distinguished Service Awards for his significant contributions.7
xxxxxAlthough Coulter only published the one paper publicizing his efforts,8 to protect improvements made during the developmental process he contributed as an inventor to 85 U.S. patents. These, and details in his personal papers, are the only record of this developmental work he himself left. Regrettably, many of his papers were apparently discarded or lost during Coulter Corporation’s move from Hialeah, FL, to Kendall, FL, in 1992-94. Consequently, attempts to document the history of those early phases of the Coulter story have been persistently conjectural or promotional rather than factual.9 However, included among those personal papers were ones that support Coulter’s motivation being accurate and rapid blood-cell counts, a motivation inspired by the need to effectively monitor bone-marrow recovery from radiation exposure such as endured by survivors of the Hiroshima and Nagasaki atomic bombings of August 1945.
xxxxxDuring my service as Coulter’s technical advisor from mid-1978 until Beckman Instruments bought and merged with Coulter Corporation in late 1997, he provided access to personal papers he kept in his Hialeah office. My collection of those papers began in 1982 when he either gave me or permitted my photocopying items from his personal files while I drafted his nomination as a Fellow of the Institute of Electrical and Electronics Engineers (IEEE). This information, plus that gleaned from files kept by his father, Joseph R. Coulter, Sr., enabled not only my review of the origin of the Coulter Principle,10 but also summaries of both the aforesaid developmental process11 and Coulter’s family background,12 as well as my history MA thesis detailing said process through his introduction of the Model S hematology analyzer.13 As of December 1, 2023, there have been 764 thesis downloads in the US and a further 676 among 84 other countries, and it should be of interest to others curious about medical biophysics and bioengineering technology.
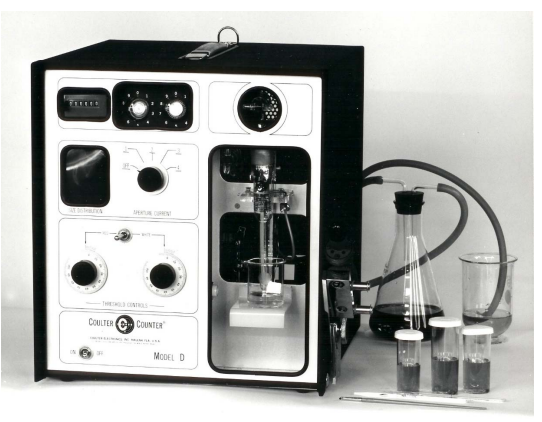
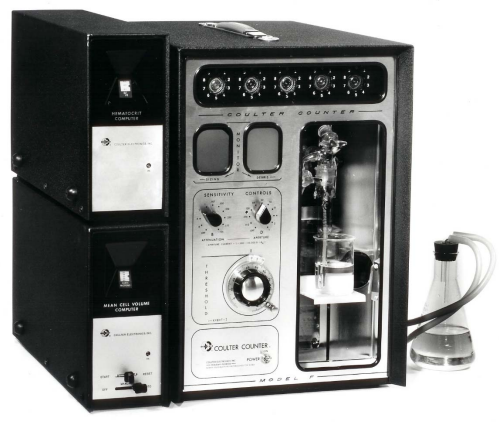
xxxxxBy 1969 the Coulter Counter® Model A (Figure 2) would be followed by additional implementations of the Coulter Principle: the Model B (Figure 3a), the Model C (Figure 4), the Model D (Figure 5), and the Model F (Figure 6) counters, as well as the Model S hematology analyzer (Figure 7). With reference to Figure 2, the sample-handling portion of the evolving Coulter instrumentation was also provided a second stopcock through which clean electrolyte solution could flush the sample tube free of sample that had flowed through the sensing aperture as a result of the first stopcock’s function (Figure 1). As shown in their respective figures, in the Models A, B, and C counters the sample-handling portion was implemented in a separate sample stand; in the Models D, F, and S instruments it was internal to the electronics cabinet. To maintain particles in suspension, in industrial versions of the Models A, B, and C counters the sample-handling portion was often provided with a propeller-shaped stirrer blade driven by a variable-speed electric motor (Figure 4).14
xxxxxThe evolution of the signal processing portion of the Coulter instrumentation constitutes a major part of the thesis discussion and will be summarized in the following text.
xxxxxIn Model A counters, signal processing produced a stream of signal pulses from a controlled sample volume flowing through the sensing aperture simultaneously with a quasiconstant current from the main amplifier’s constant-voltage power source (Figure 1). Signal pulses were thus sensitive not only to non-liquid components of the sample, but also to variations in aperture geometry, temperature of the aperture’s environment, the temperature-dependent resistivity of the suspending diluent, and with some diluents frequently required by industrial suspensions, polarity-dependent polarizations of the sensing electrodes. The pulses were amplified by a circuit that eliminated pulses below an adjustable amplitude threshold before passing them to the counting circuitry. By incrementally increasing the threshold setting and recording the count for sequential sample runs, an operator could manually generate a cumulative volume distribution for the non-liquid sample constituents of interest. However, the sequential sample runs required considerable amounts of both sample and operator time, and the cumulative distributions were less desirable than differential distributions. While the latter could be derived from the former, arithmetical calculations often contaminated the result with significant errors.
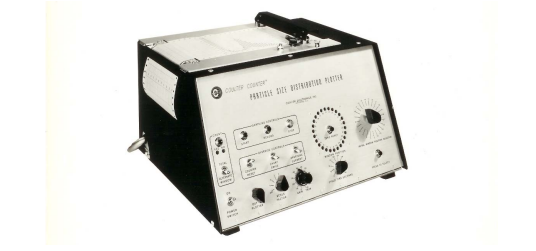
xxxxxTo minimize pulse sensitivity to the aforesaid factors, Model B counters (Figure 3a) were provided with a truly constant aperture current and a current-sensitive main amplifier. They were also provided with a second threshold circuit, interlockable with the first, whereby the operator could increment a differential distribution bin over sequential sample runs; while this did not greatly reduce either required sample volumes or operator time, it minimized calculation errors. When the movable bin was controlled by a sequencing four-second timer, an accessory Model H plotter (Figure 3b) could automatically accumulate 25-bin differential volume distributions from constant-flow sample runs lasting some 100 seconds, with the pulses and counts within individual bins being displayed. User reports are available.15 While the circuitry improvements in Model B counters and the innovative capability of the Model H plotter and its replacement, the Model J plotter,16 offered improved analytic efficiency, the lengthy sample runs and time required to sequentially acquire the bins of differential distributions prompted the next step in Coulter’s developmental process.
xxxxxThe Model C counters included multiple pulse-height analyzer circuits that simultaneously collected data for up to twelve differential volume bins from a single sample run (Figure 4). Intended for industrial applications, the complex Model C counters did not require the long sample runs required by the Model H plotter, but were expensive; to attract buyers they were introduced in six-bin, nine-bin, and twelve-bin versions with optional numbers of Dekatron display tubes for the accumulating bin counts. Only a few of the Model C counters were ever sold, but experience gained in developing them enabled design of the transistorized replacement for the Model A counter, the Model F counter discussed below.
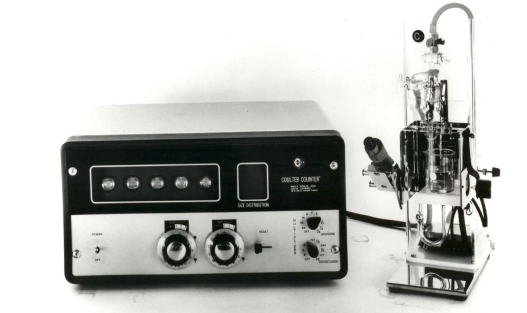
xxxxxMarket competition prompted design of the fourth implementation of the Coulter Principle, the single-threshold Model D counters, as a simplified, low-cost replacement for the Model A counter in smaller hematology laboratories. The Model D was welcomed by hematology laboratories worldwide; user reports are available.19 This dual-function counter provided switch-selectable modes, one optimized for erythrocyte counts and the other for leukocyte counts, and was the first Coulter Counter® to integrate the sample stand into the electronics cabinet (Figure 5). Subsequent versions incorporated transistors and then integrated circuits; some of these later instruments permitted broader application than the original Model D counter.
xxxxxThe transistorized Model F counter then replaced the aging Model A counter in many hematology laboratories. In the Model B, Model C, and early Model D instruments accumulating decade counts were indicated by the position of a sometimes ambiguous bright dot on Dekatron display tubes, but these would be replaced in later counters (e.g., Figures 5 and 6) by display tubes that indicated such counts with unambiguous illuminated numerals. To allow checking the sensing aperture for clogs, the single-threshold Model F counters included an internal optical system that projected an image of the aperture onto a screen in the operator’s view, so eliminating the microscope similarly used in the four earlier implementations of the Coulter Principle. Accessory modules enabled rapid computation of the mean cell volume (MCV) and hematocrit (Hct) of a blood sample; the Model M volume converter calculated a sample’s total non-liquid volume above threshold. Cell-volume distributions could be plotted by the Model J Plotter. User reports for the Model F counter are available.20
.
xxxxxSince Coulter realized the critical need for frequent, rapid, and accurate blood-cell counts following a nuclear event, he had wanted to provide a cell counter that would accept a blood sample and automatically process it to rapidly provide definitive clinical results. Unlike those engineers who try to perfect an item before marketing it, Coulter understood that it only had to be good enough (“If it’s useful, people will buy it.”), and he had persevered in developing improved implementations of his Coulter Principle. By late 1968 several of the aforesaid developments had been incorporated in the first automated hematology analyzer, the Coulter Counter® Model S (Figure 7).
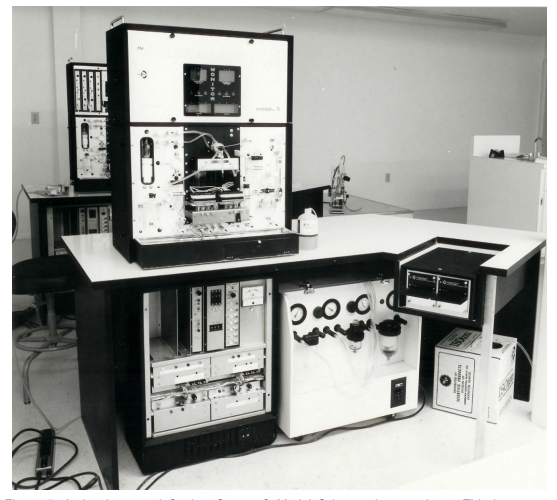
xxxxxTo use the Model S hematology analyzer, the technologist had only to present a blood sample to a sample probe and initiate the automated process. Venous blood samples were diluted appropriately for a leukocyte count with isotonic NaCl solution, then split, one part being lysed and sent to a hemoglobin bath while the other part was diluted appropriately a second time for an erythrocyte count and sent to a second bath. The two dilutions were each drawn through three Coulter sensing apertures, of 100-μm diameter for processing leukocytes and of 70-μm diameter for analyzing erythrocytes. The signal streams from the six apertures were analyzed and corrected for coincidence; if there were no inconsistencies in any aperture signal stream, those from the three like apertures were forwarded to independent counting circuits, the results from which were then averaged to provide rapid and accurate counts with excellent statistical repeatability. However, if the cellular signal stream from one aperture differed significantly from those from the other two like apertures, for example, due to a partial aperture blockage, that aperture’s results were voted out of the data to be averaged, and the technologist was warned of the discordant signal stream. Although the reported counts then depended on only two cellular signal streams, their accuracy was still significantly better than provided by earlier methods. The cellular counts provided the sample’s leukocyte count (WBC) and erythrocyte count (RBC). The latter was used to calculate the average volume of the erythrocytes (MCV) and combined with a hemoglobin measurement (Hb) from the leukocyte bath to yield the volume percentage of erythrocytes (hematocrit, Hct, or packed cell volume, PCV), the average mass of hemoglobin per erythrocyte (MCH), and the ratio of Hb to Hct (MCHC). For the first time it was possible to efficiently assess a patient blood sample via rapid, accurate, and repeatable automated determinations of these seven blood parameters, which were printed within less than a minute of the technologist presenting the blood sample.
xxxxxIn this essay I have only outlined Coulter’s journey from his comprehension of the critical need for accurate, repeatable, and rapid blood-cell counts through his commercialization of the Coulter Principle in the groundbreaking Model A counter and its incremental elaboration into the revolutionary Model S hematology analyzer. The thesis provides much greater detail regarding that journey and the shifting historical context in which it occurred.22 As an introduction to the early production instruments mentioned therein, this essay should be of interest to not only readers involved with clinical hematology, but also to anyone curious about medical biophysics and bio-engineering technology.
Acknowledgements
Based on research as a Donovan Fellow for the MA degree in history at the University of Kentucky, Lexington. The Donovan Program provided all required tuition. As an introductory overview of the thesis, an edited version of this essay without instrument images has been published (The Coulter Principle: A history. Cytometry A 2022;101A:8-11).
About The Author
Marshall Don. Graham was Technical Advisor to Wallace H. Coulter, June 1978 to November 1997, Coulter Corporation; Principal Staff Development Scientist, emeritus, December 2011, Beckman Coulter, Inc.
Related TBP Content
Did you know that Wallace H Coulter (1913 – 1998) was an American electrical engineer?
.
.