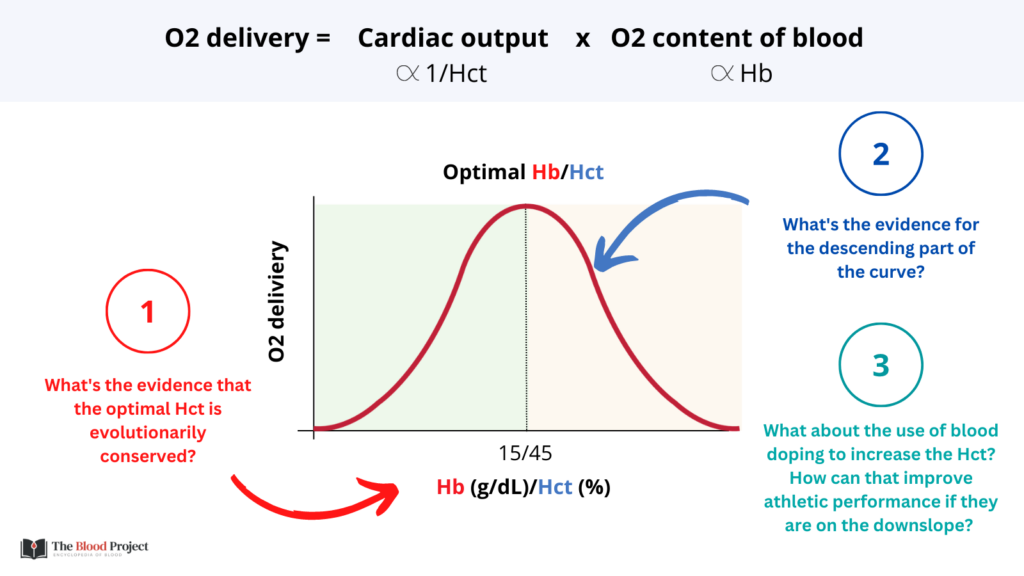
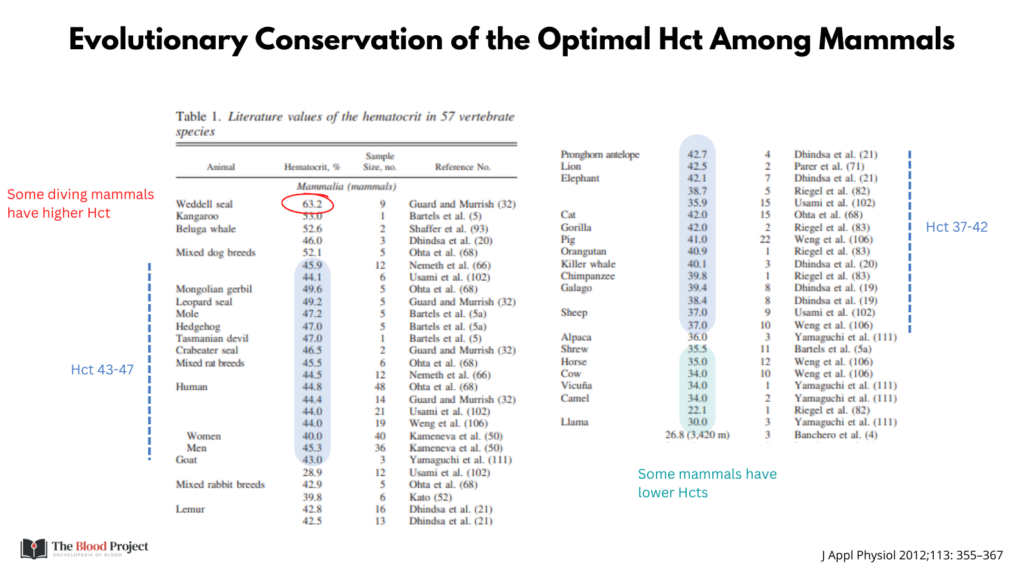
Q1. What is the evidence that the optimal Hct is conserved across mammalian species?
A1. Pretty good, actually. Check out the Hct measurements from multiple mammalian species in the next graphic.
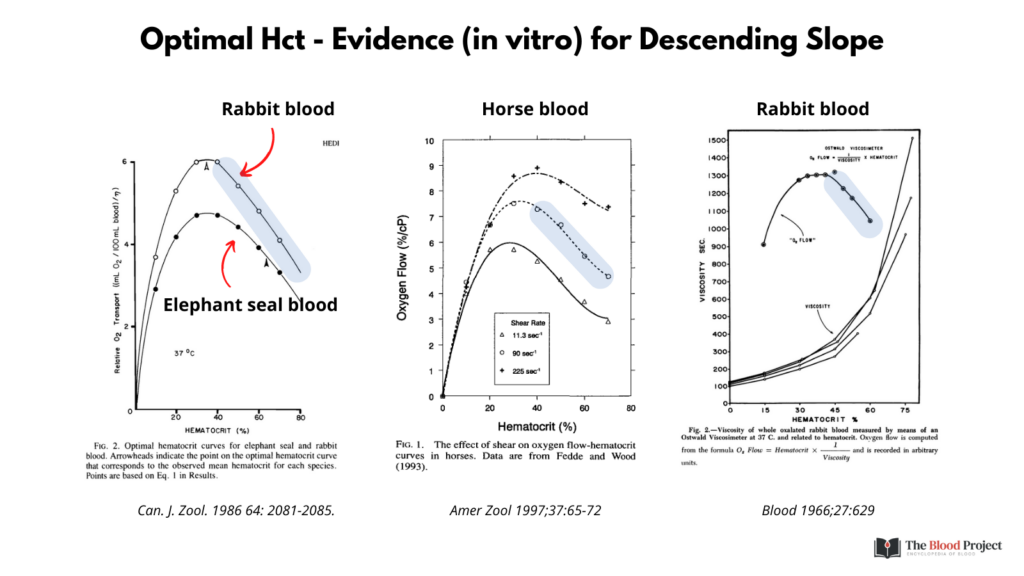
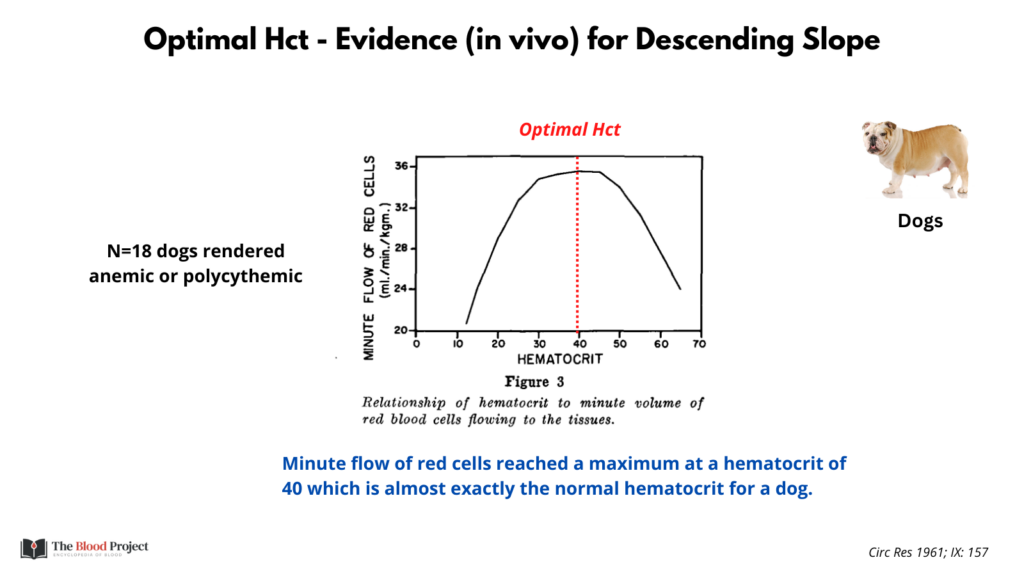
Q2. What is the evidence for the descending part of the curve?
A2. The evidence is based on both in vitro and in vivo experiments as well as modeling. The graphic below shows supportive in vitro data.
… the next graphic shows original in vivo data from Guyton (of Guyton physiology textbook fame) from dogs. Flow of RBCs is used as surrogate marker for oxygen delivery.
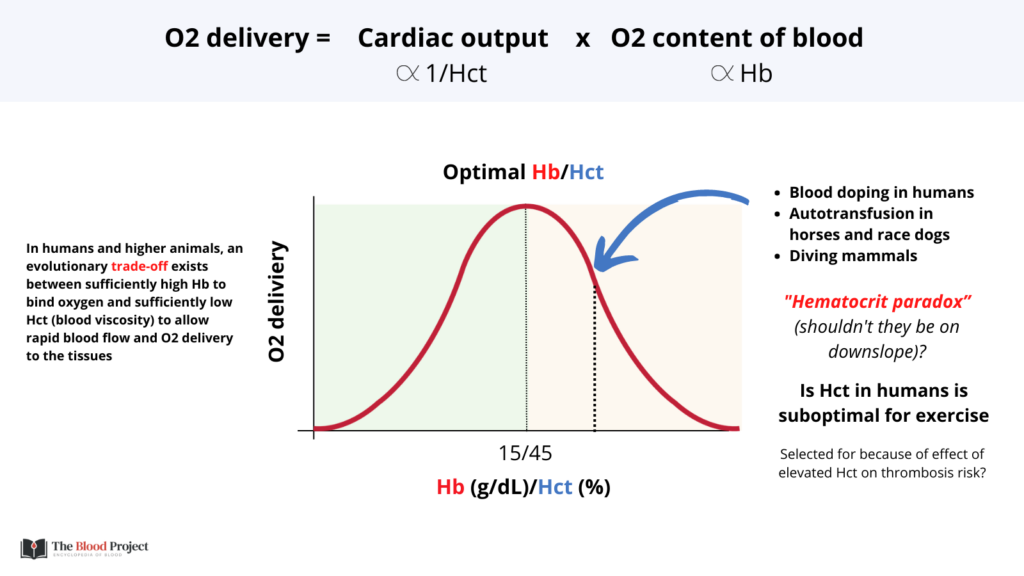
Q3. What about athletes who increase their Hct by doping? They are reported to improve their exercise capacity, yet they are are predicted to lie downhill on the curve.
A3. This is known as the HEMATOCRIT PARADOX!
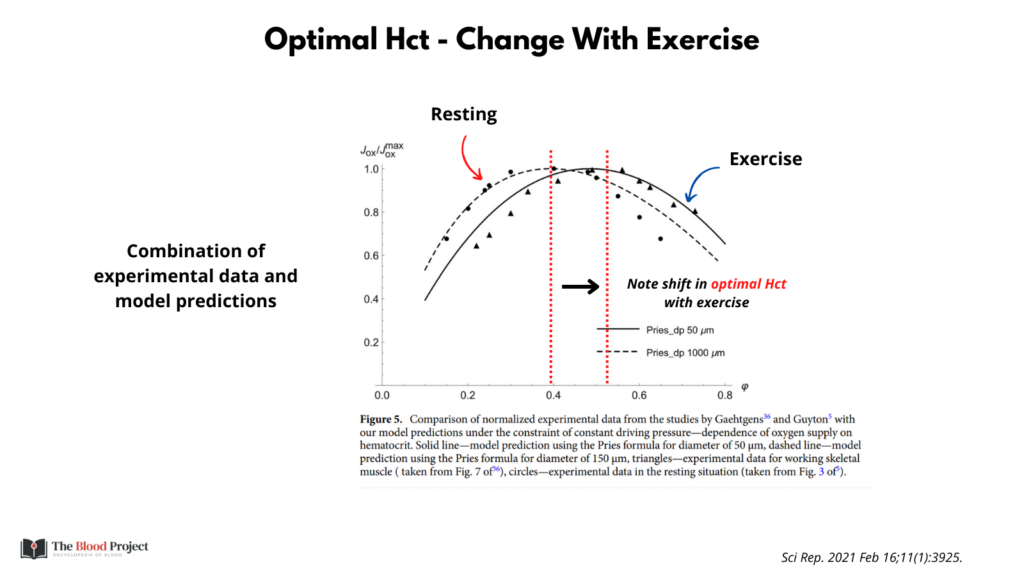
Turns out that the curve is shifted to the right during exercise. This is shown in an elegant study in mice whose Hct was acutely elevated by administering an erythropoiesis-stimulating agent and then assayed for maximal O2 uptake during submaximal exercise (see next graphic).
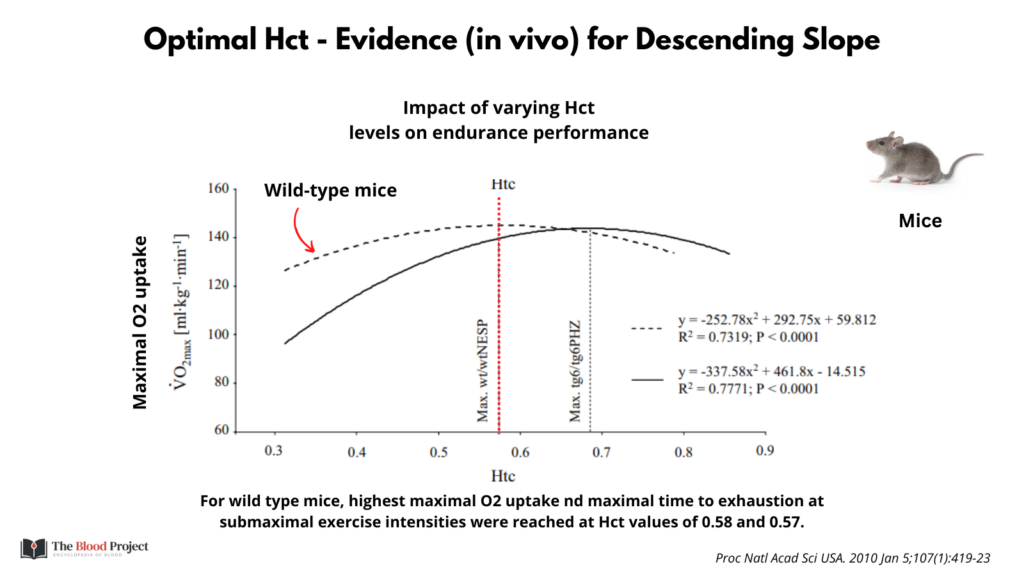
Another study using novel modeling parameters also demonstrated/predicted a right shift in the curve during exercise (see reference in next graphic).