Labs
The following are partial results from the patient’s complete blood count (CBC):
| WBC (109/L) | Hb (g/dL) | MCV (fL) | PLT (109/L) |
|---|---|---|---|
| 9.1 | 12.3 | 61 | 174 |
What’s what: WBC, white blood cell count; Hb, hemoglobin; MCV, mean cell volume; MCHC, mean cellular hemoglobin concentration; RDW-SD, red cell distribution width-standard deviation; platelets, PLT; Normal values: WBC 5-10 x 109/L, RBC 4-6 x 10¹²/L, Hb 12-16 g/dL, Hct 35-47%, MCV 80-100 fL, MCHC 32-36 g/dL, RDW-SD < 45 fL, platelets (PLT) 150-450 x 109/L
True or false: this patient likely has iron deficiency anemia.
Mentzer index ratio:
- > 13 suggests iron deficiency
- < 13 suggests thalassemia minor/trait
When you see the patient, the red cell count is 6.06 x 10¹²/L.
MCH, mean corpuscular hemoglobin
MCHC, mean corpuscular hemoglobin concentration
Mean corpuscular hemoglobin (MCH) in thalassemia minor/trait:
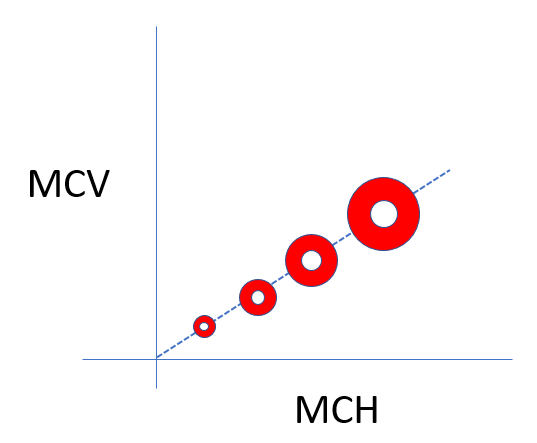
Mean corpuscular hemoglobin concentration (MCHC) in thalassemia minor/trait:
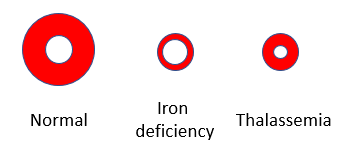
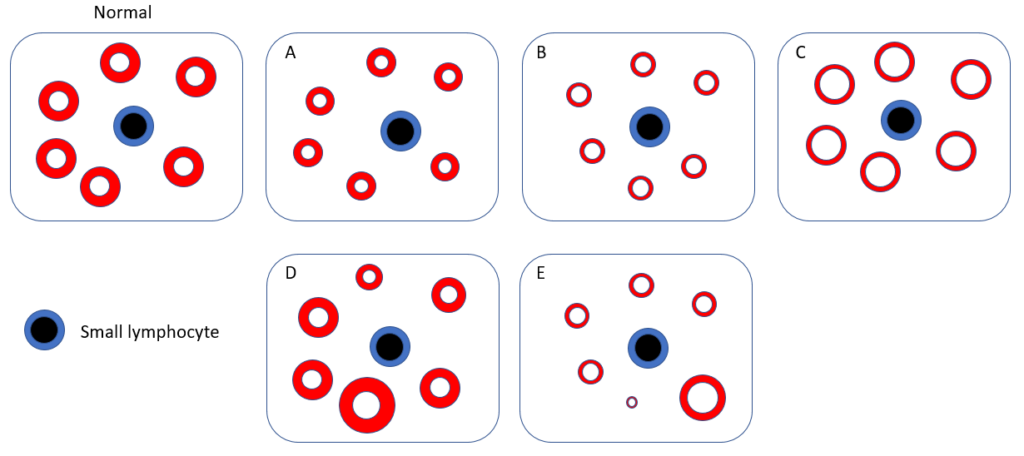
One of the distinguishing features between iron deficiency and thalassemia is that the red cells in iron deficiency tend to have low mean corpuscular hemoglobin concentration (MCHC), which corresponds to increased central pallor, while those in thalassemia minor tend to have normal MCHC and normal central pallor.
Here are more data from the complete blood count (CBC):
| Hb (g/dL) | MCV (fL) | MCH (pg) | MCHC (g/dL) | RDW-CV | RDW-SD |
|---|---|---|---|---|---|
| 12.3 | 61 | 20.3 | 33.1 | 17.2 | 33.2 |
What’s what: WBC, white blood cell count; Hb, hemoglobin; MCV, mean cell volume; MCHC, mean cellular hemoglobin concentration; RDW-SD, red cell distribution width-standard deviation; platelets, PLT; Normal values: WBC 5-10 x 109/L, RBC 4-6 x 10¹²/L, Hb 12-16 g/dL, Hct 35-47%, MCV 80-100 fL, MCHC 32-36 g/dL, RDW-CV <16%; RDW-SD < 45 fL, platelets (PLT) 150-450 x 109/L
Note:
- Mean corpuscular hemoglobin (MCH) is low.
- Mean corpuscular hemoglobin concentration (MCHC) is normal.
RDW-CV, red cell distribution width coefficient of variation
RDW-SD, red cell distribution width standard deviation
Which schematic is most likely to represent the patient’s peripheral smear?
Here are the results of the patient’s iron indices:
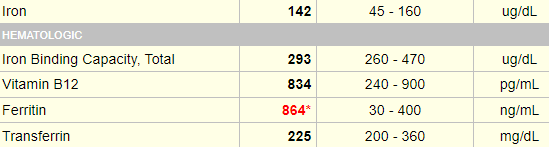
Are these results consistent with iron overload?
The results of the hemoglobin (Hb) electrophoresis (Sebia Hydrase alkaline method) were the following:
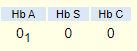
How would you interpret these results?
In fact, the diagnosis was HbE disease (HbEE)

Diagnosis was based on Hb electrophoresis using cellulose acetate at alkaline pH, and then agarose gel at acid pH.
Let’s see how Hb electrophoresis can used to discriminate between different hemoglobinopathies. Typically, samples are run on cellulose acetate at alkaline pH, and then on an agarose gel at acid pH. Different types of hemoglobin migrate in distinct patterns on each gel allowing for identification of the relevant hemoglobin:


Hemoglobinopathies
The differential diagnosis of microcytosis includes iron deficiency and alpha- or beta-thalassemia. Now we have just learned that HbEE also causes microcytosis. Are there other hemoglobinopathies that we should consider in a patient with microcytosis? Well, let’s step back and consider hemoglobinopathies, a group of recessively inherited genetic conditions affecting the alpha or beta globin chains of hemoglobin. Hemoglobinopathies are the most common autosomal recessive disorder worldwide, with 7% of the global population carrying an abnormal hemoglobin alpha or beta globin chain allele.
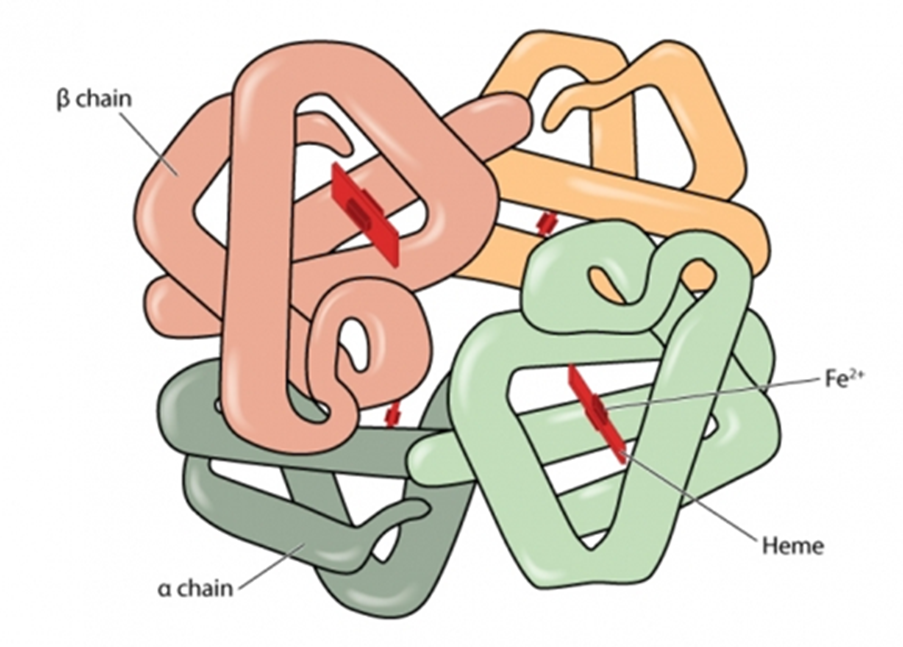
Hemoglobinopathies may be split into 2 groups, one leading to quantitative changes in hemoglobin (termed thalassemia), the other to qualitative changes (termed structural variants):
- Thalassemia syndromes:
- Quantitative defect caused by decreased expression of one of the two globin chains of the hemoglobin molecule, α (HBA) and β (HBB).
- Decreased expression can result from:
- Deletion of the structural gene(s).
- Mutations that result in decreased RNA synthesis, processing, or stability.
- Mutations resulting in decreased protein synthesis or stability.
- The decrease in expression of one of the globin chains results in accumulation of excess polypeptides encoded by the unaffected gene. This chain imbalance causes abnormal RBC maturation, resulting in microcytosis as the characteristic laboratory abnormality.
- Thalassemia syndromes include:
- Alpha-thalassemia
- Beta-thalassemia
- Hb E
- As in our patient
- Hb E actually has a thalassemia phenotype
- Structural hemoglobin variants:
- The hemoglobin variants are caused by amino acid substitutions in either globin chain.
- Clinical disease includes:
- Thalassemia-like phenotype (HbE)
- Sickling (HbS)
- Hemolysis due to unstable hemoglobins
- Hemoglobins associated with altered oxygen affinity
- Hemoglobins in which iron cannot be maintained in the ferrous (Fe2+) state
- The main Hb abnormalities worldwide are:
- Hb S
- Hb C
- Hb E
- Rarer abnormalities that may have clinical significance include:
- Hb D
- Hb OArab
- Hb Lepore
A word on beta-thalassemia trait and iron stores
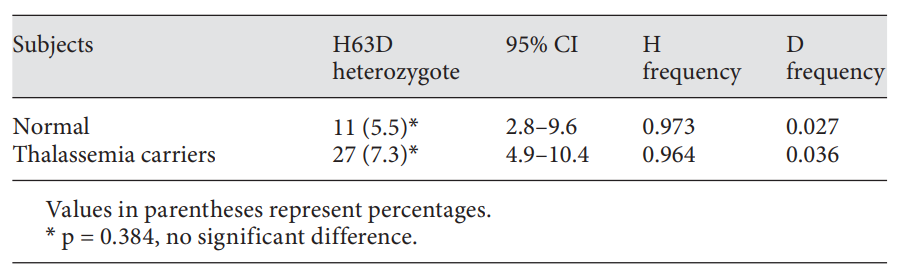
Beta thalassemia trait is characterized by mild, ineffective erythropoiesis that can induce excess iron absorption and ultimately lead to iron overload (J Hum Genet (2004) 49:651–655). This may be aggravated with the coinheritance of C282Y or H63D mutation. C282Y is extremely rare in Southeast Asia (our patent was from Cambodia), whereas H63D is more widely distributed.
In a study from Thailand, H63D heterozygotes were found in 5.5% (11/201) of normal subjects and 7.3% (27/370) of thalassemia carriers, leading to mutant allele frequencies of 0.027 and 0.036 in normal subjects and thalassemia carriers, respectively. The proportions of subjects with elevated ferritin were found to be 37.5% (6/16) for those with the H63D mutation and 14.0% (18/129) for those without the mutation in males and 0% (0/11) for for those with the H63D mutation and 3.0% (5/164) for those without the mutation in female subjects, respectively. The H63D heterozygosity has no significant effect on the serum ferritin level and the authors concluded that screening for this HFE mutation in thalassemic patients is not recommended. Similar findings were observed in a subgroup of 14 HbE/-thalassemia patients.