Labs
The following is part of the complete blood count (CBC) when you first see the patient:
| WBC (109/L) | Hb (g/dL) | MCV (fL) | PLT (109/L) |
|---|---|---|---|
| 8.8 | 8.1 | 55 | 516 |
What’s what: WBC, white blood cell count; Hb, hemoglobin; MCV, mean cell volume; MCHC, mean cellular hemoglobin concentration; RDW-SD, red cell distribution width-standard deviation; platelets, PLT; Normal values: WBC 5-10 x 109/L, RBC 4-6 x 10¹²/L, Hb 12-16 g/dL, Hct 35-47%, MCV 80-100 fL, MCHC 32-36 g/dL, RDW-SD < 45 fL, platelets (PLT) 150-450 x 109/L
Mean corpuscular hemoglobin (MCH)
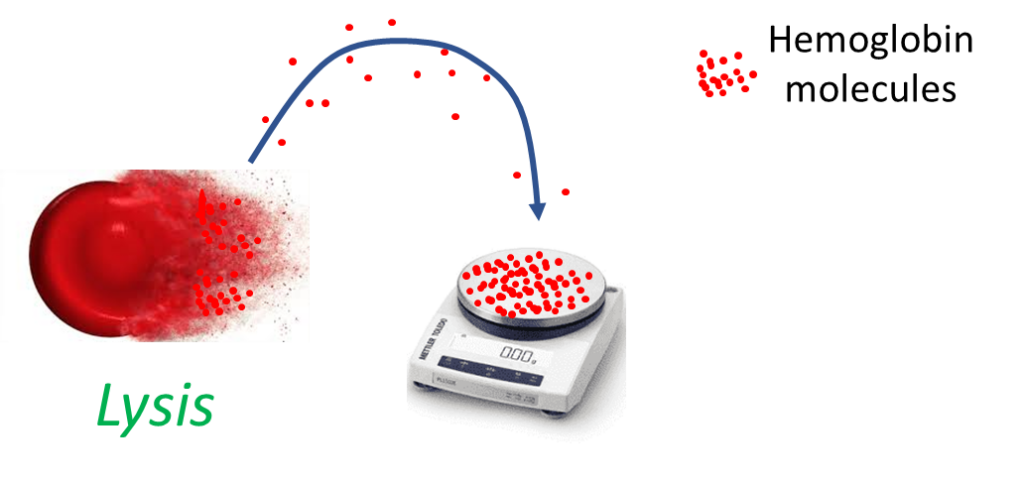
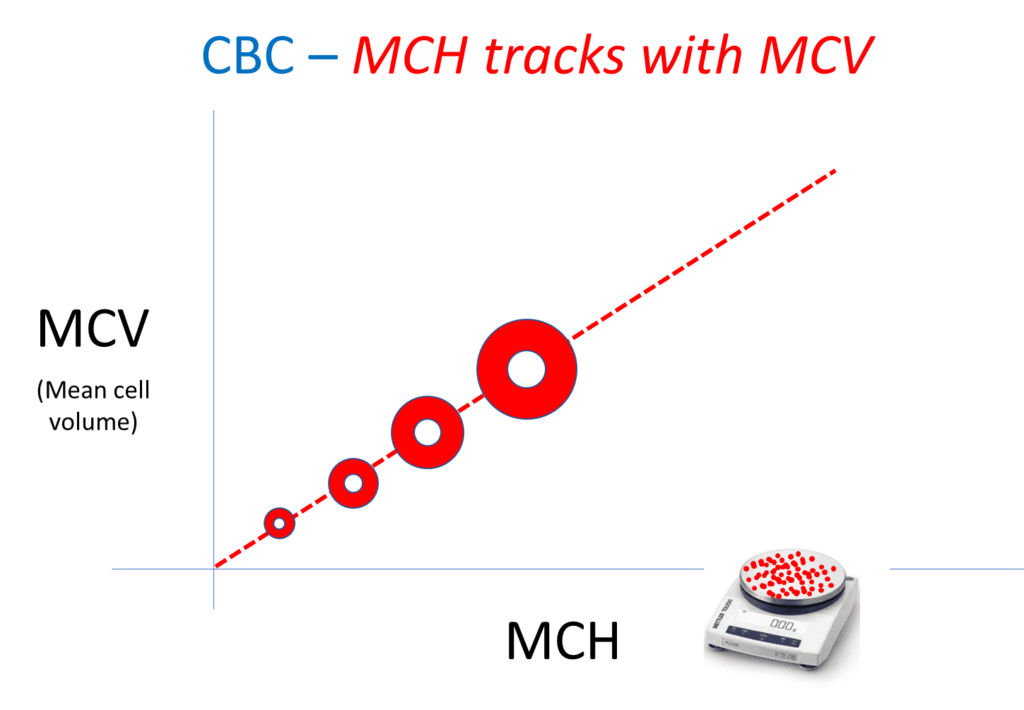
Mean corpuscular hemoglobin (MCH)
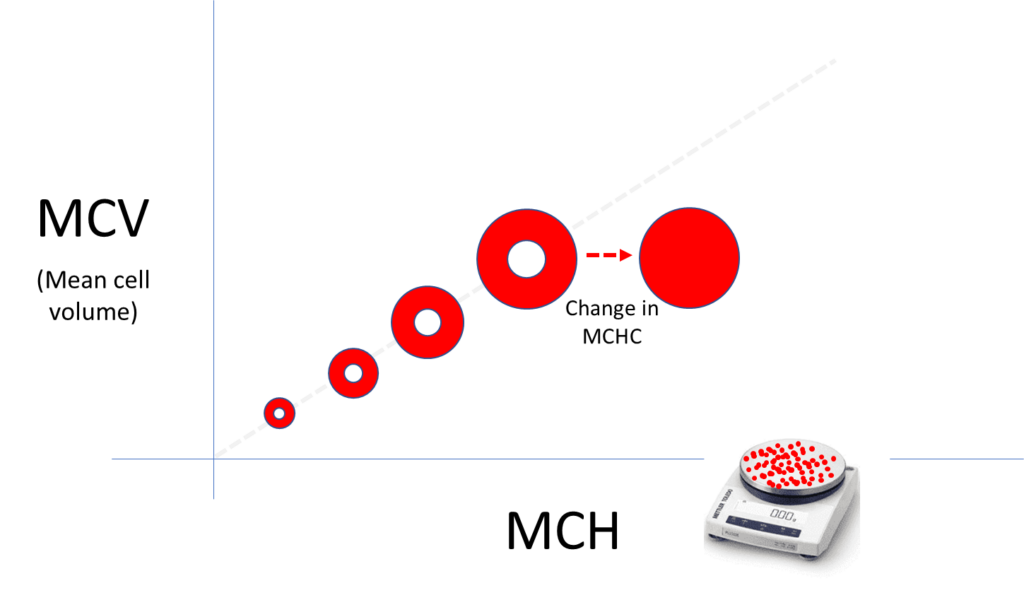
Mean corpuscular hemoglobin concentration
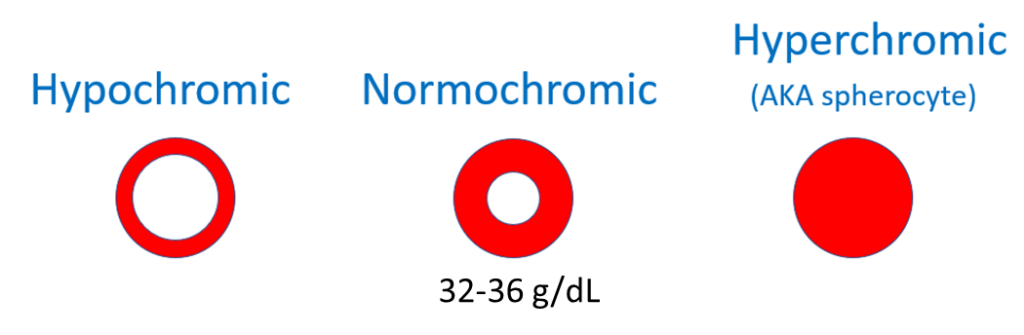
While the mean corpuscular hemoglobin is the average weight of the red cell in hemoglobin, the mean corpuscular hemoglobin concentration describes the average concentration of hemoglobin inside red cells. A lower-than-normal hemoglobin concentration manifests as hypochromia on the peripheral smear (increased area of central pallor). A higher-than-normal hemoglobin concentration manifests as hyperchromia (loss of central pallor, which is indicative of a spherocyte).
Consider the following thought experiment: Planet earth is one giant red cell. It’s inner hemoglobin (Hb)-free core comprises 1/3 of the volume of the planet. The rest is made of hemoglobin (Hb).
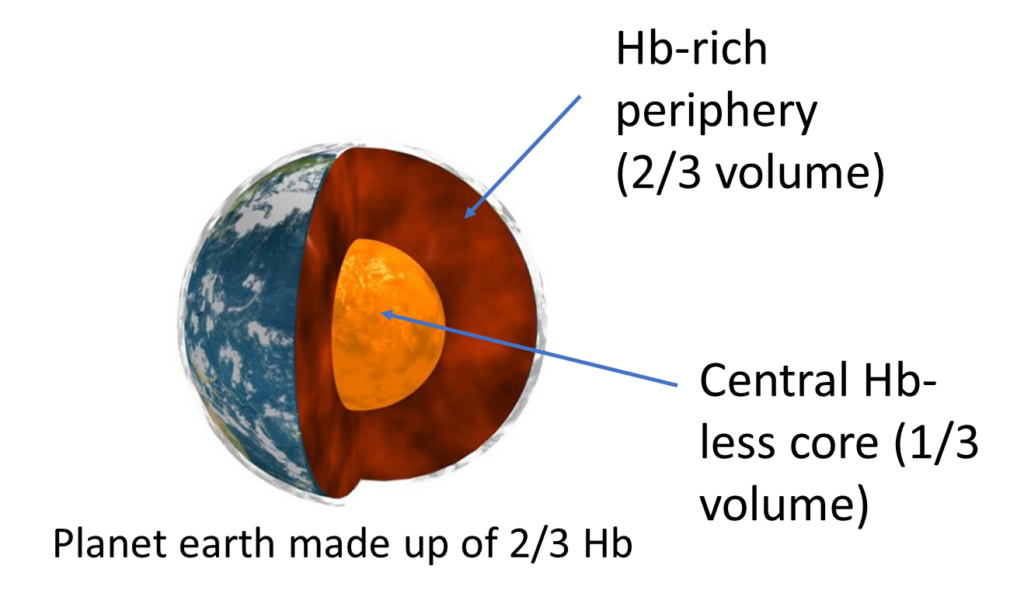
What is the “MCH” and what is the “MCHC” of this insanely large cell?
MCH, mean cell hemoglobin; MCHC, mean cell hemoglobin concentration
Let’s return to the CBC and fill in the MCH and MCHC:
| WBC (109/L) | Hb (g/dL) | MCV (fL) | MCH (pg) | MCHC (g/dL) | PLT (109/L) |
|---|---|---|---|---|---|
| 8.8 | 8.1 | 55 | 13.6 | 24.8 | 516 |
What’s what: WBC, white blood cell count; Hb, hemoglobin; MCV, mean cell volume; MCHC, mean cellular hemoglobin concentration; RDW-SD, red cell distribution width-standard deviation; platelets, PLT; Normal values: WBC 5-10 x 109/L, RBC 4-6 x 10¹²/L, Hb 12-16 g/dL, Hct 35-47%, MCV 80-100 fL, MCHC 32-36 g/dL, RDW-SD < 45 fL, platelets (PLT) 150-450 x 109/L
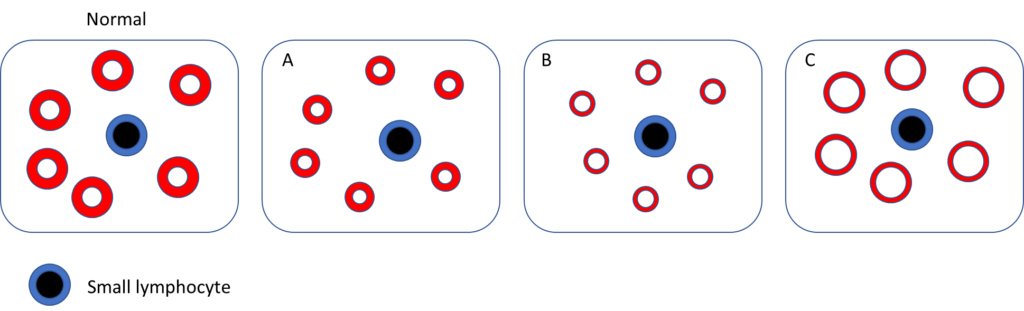
Which of the following schematic of peripheral blood smear best fits the patient?
The mean cell volume (MCV) and mean corpuscular hemoglobin concentration (MCHC) are both incorporated in the traditional morphological classification of anemia:
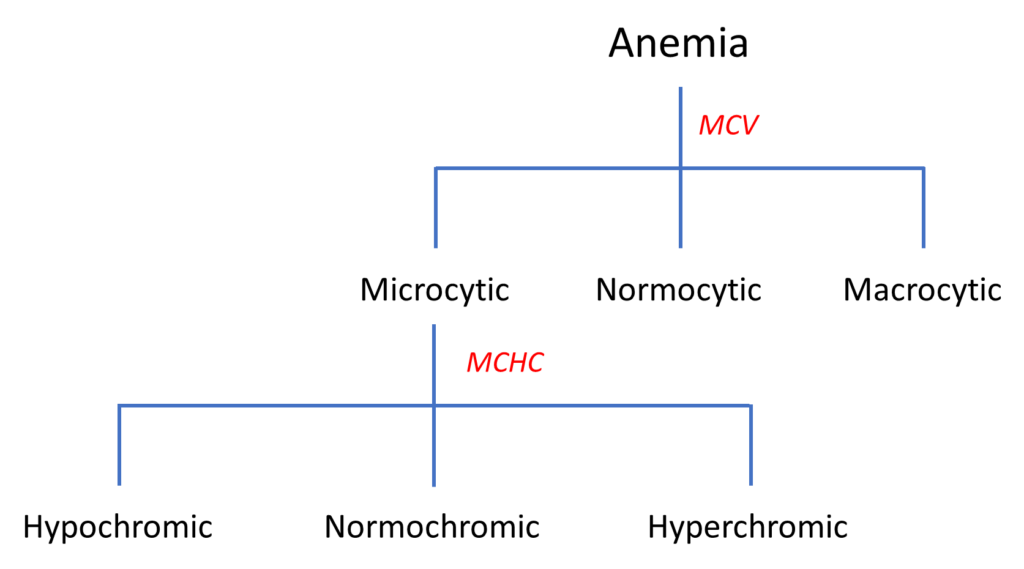
Note that the MCH is nowhere to be found!
Here is the serum ferritin result:

Which of the following would you predict:
Here is the full iron panel:
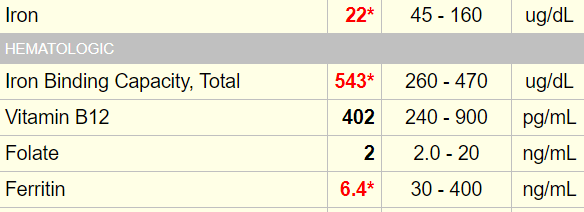
TSAT, transferrin saturation
Here are the results of the hemoglobin (Hb) electrophoresis (the numbers are reported as % of total Hb):
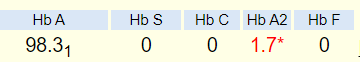
Normal HbA2 levels are 2.2% – 3.3%.
Relation between HbA2 and MCV in 150 patients with iron deficiency:
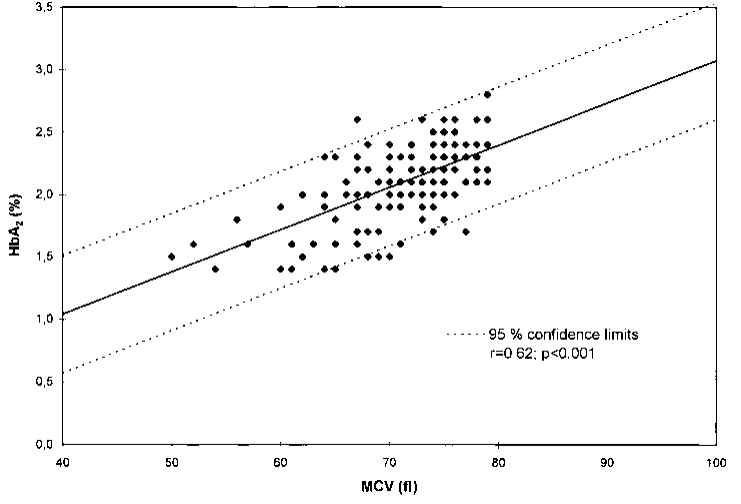
An explanation of why/how iron deficiency leads to low HbA2 levels:
Iron insufficiency leads to the formation of a repressor of initiation of protein synthesis which preferentially affects α globin chain initiation, resulting in a relative deficiency of α chains. With the β chains being more competitive than δ chains in heme binding, HbA is formed preferentially, compared to HbA2. The lack of iron, interfering with δ chain synthesis and decreased transcription or translation of the δ globin gene in iron deficiency anemia (IDA) have also been put forth as mechanisms for low HbA2 levels in IDA.
Mutation Research-Reviews in Mutation Research 788 (2021) 108387
Because iron deficiency suppresses HbA2 expression and therefore masks the effect of beta thalassemia on HbA2 levels, the results of the hemoglobin electrophoresis are not interpretable in the setting of iron deficiency. This difficulty is articulated in an addendum to the patient’s results:

The hemoglobin electrophoresis is unchanged in alpha thalassemia. A normal hemoglobin electrophoresis in a patient with microcytosis of unclear etiology and normal iron stores is generally assumed to be caused by alpha thalassemia.
Several discriminant formulas have been published for distinguishing thalassemia from iron deficiency in patients with microcytic anemia:
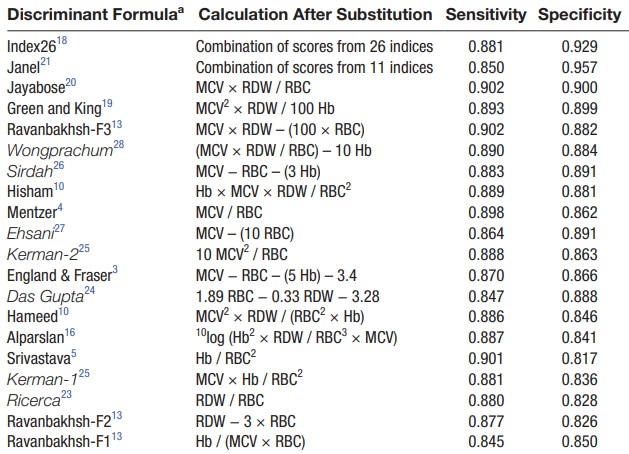
It is interesting to note that despite the observation that iron deficiency is associated with a lower mean corpuscular hemoglobin concentration compared to thalassemia, the mean corpuscular hemoglobin concentration (MCHC) is conspicuously absent from these formulas.
Among the more popular formulas is the Mentzer index, first described in 1973. The index is very simple: MCV/RBC.


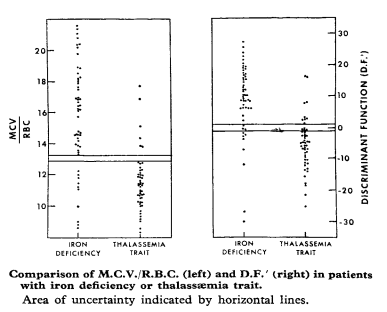
Mentzer Index > 13 indicates a greater likelihood of iron deficiency anemia diagnosis.
What is the Mentzer index really saying?
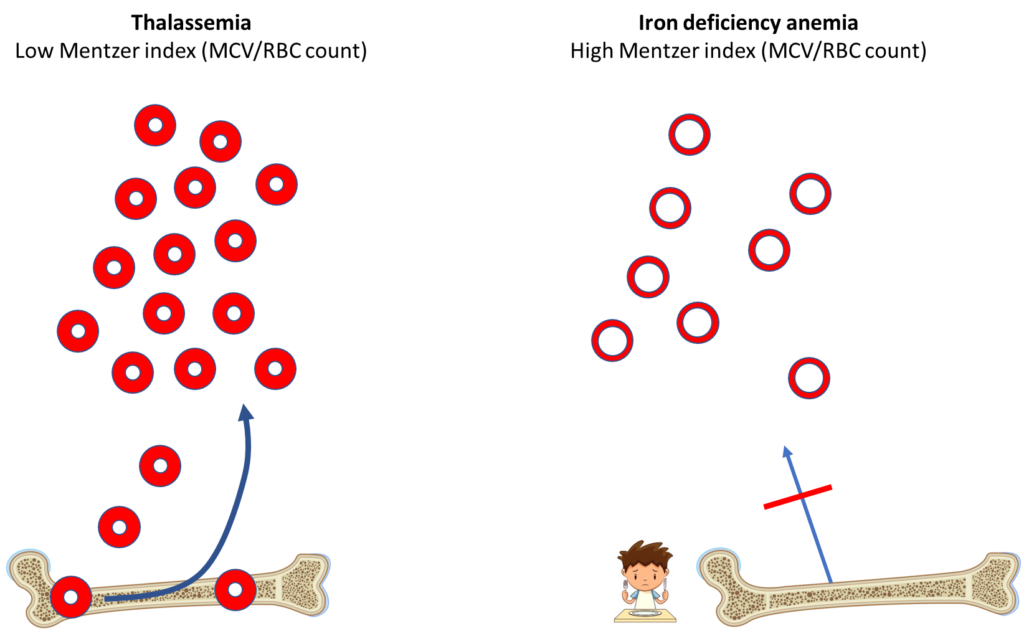
The Mentzer index reflects the fact that in iron deficiency, the loss of the essential nutrient, iron, causes a block in erythropoiesis and decreased production of red blood cells (RBCs), while in thalassemia, no such block occurs. In thalassemia, the bone marrow works overtime to compensate for the small RBC size by producing and releasing many more cells. The index also takes into consideration that the MCV tends to be lower in thalassemia.
Before moving on to treatment, let’s consider a couple more lab results from the complete blood count. As we noted earlier, the platelet count is elevated:
| WBC (109/L) | Hb (g/dL) | MCV (fL) | PLT (109/L) |
|---|---|---|---|
| 8.8 | 8.1 | 55 | 516 |
What’s what: WBC, white blood cell count; Hb, hemoglobin; MCV, mean cell volume; MCHC, mean cellular hemoglobin concentration; RDW-SD, red cell distribution width-standard deviation; platelets, PLT; Normal values: WBC 5-10 x 109/L, RBC 4-6 x 10¹²/L, Hb 12-16 g/dL, Hct 35-47%, MCV 80-100 fL, MCHC 32-36 g/dL, RDW-SD < 45 fL, platelets (PLT) 150-450 x 109/L
Now let’s consider the red cell distribution width (RDW). There are two ways to express the RDW
- RDW coefficient of variation (RDW-CV, labeled simply as RDW in the results below)
- RDW standard deviation (RDW-SD)
| WBC (109/L) | Hb (g/dL) | MCV (fL) | RDW-CV | RWD-SD | PLT (109/L) |
|---|---|---|---|---|---|
| 8.8 | 8.1 | 55 | 24.5 | 43.8 | 516 |
What’s what: WBC, white blood cell count; Hb, hemoglobin; MCV, mean cell volume; MCHC, mean cellular hemoglobin concentration; RDW-SD, red cell distribution width-standard deviation; platelets, PLT; Normal values: WBC 5-10 x 109/L, RBC 4-6 x 10¹²/L, Hb 12-16 g/dL, Hct 35-47%, MCV 80-100 fL, MCHC 32-36 g/dL, RDW-SD < 45 fL, platelets (PLT) 150-450 x 109/L
The RDW-CV is significantly increased, whereas the RDW-SD is essentially normal.