Labs

We have already considered the patient’s hemoglobin, mean cell volume (MCV) and mean corpuscular hemoglobin concentration (MCHC). The following is the rest of the complete blood count (CBC) from the day you see him in clinic:
| WBC (109/L) | Hb (g/dL) | MCV (fL) | MCHC (g/dL) | PLT (109/L) |
|---|---|---|---|---|
| 15 | 8.4 | 117 | 30.1 | 740 |
What’s what: WBC, white blood cell count; Hb, hemoglobin; MCV, mean cell volume; MCHC, mean cellular hemoglobin concentration; RDW-SD, red cell distribution width-standard deviation; platelets, PLT; Normal values: WBC 5-10 x 109/L, RBC 4-6 x 10¹²/L, Hb 12-16 g/dL, Hct 35-47%, MCV 80-100 fL, MCHC 32-36 g/dL, RDW-SD < 45%, platelets (PLT) 150-450 x 109/L
Notice how the CBC shown above does not provide the hematocrit value.
In patients with anemia, oxygen content of the blood is limiting (oxygen content correlates with Hb x oxygen saturation). Hemoglobin, not hematocrit (Hct), carries oxygen. Hct is simply a fractional volume and is a function only of the cell size and number of cells (Hct = mean cell volume [MCV] x red cell count). In theory one could have a normal Hct with zero hemoglobin. So, hemoglobin is the appropriate parameter to use when considering or discussing a patient with anemia.
For more information, see our infographic on Hb vs. Hct.
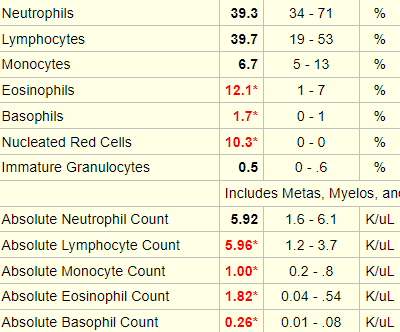
The following is the patient’s white cell differential:
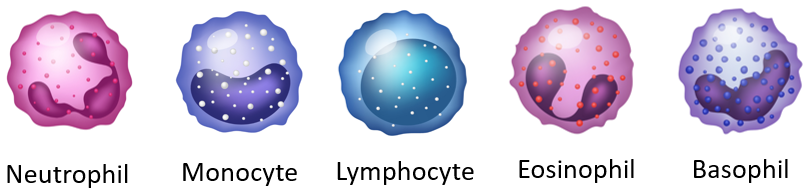
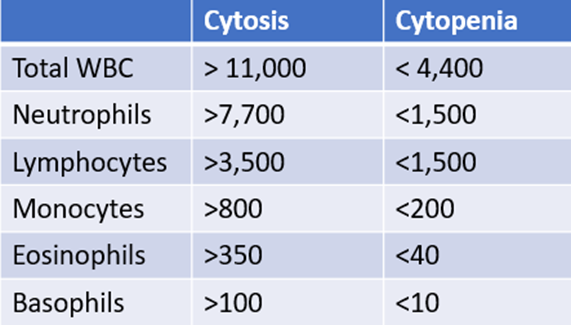
In case you need some help, here is a “cheat sheet”:
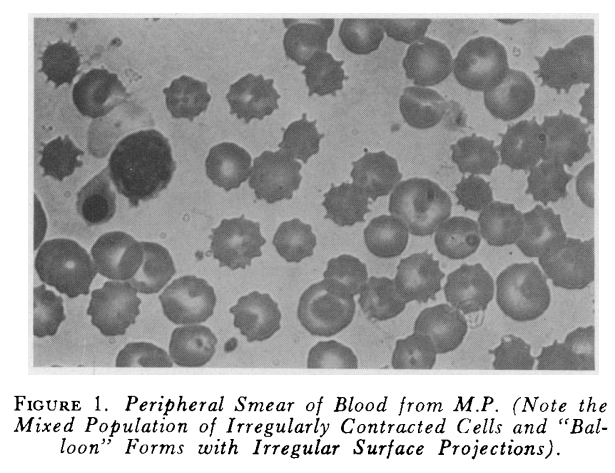
The following is the peripheral smear from the patient:
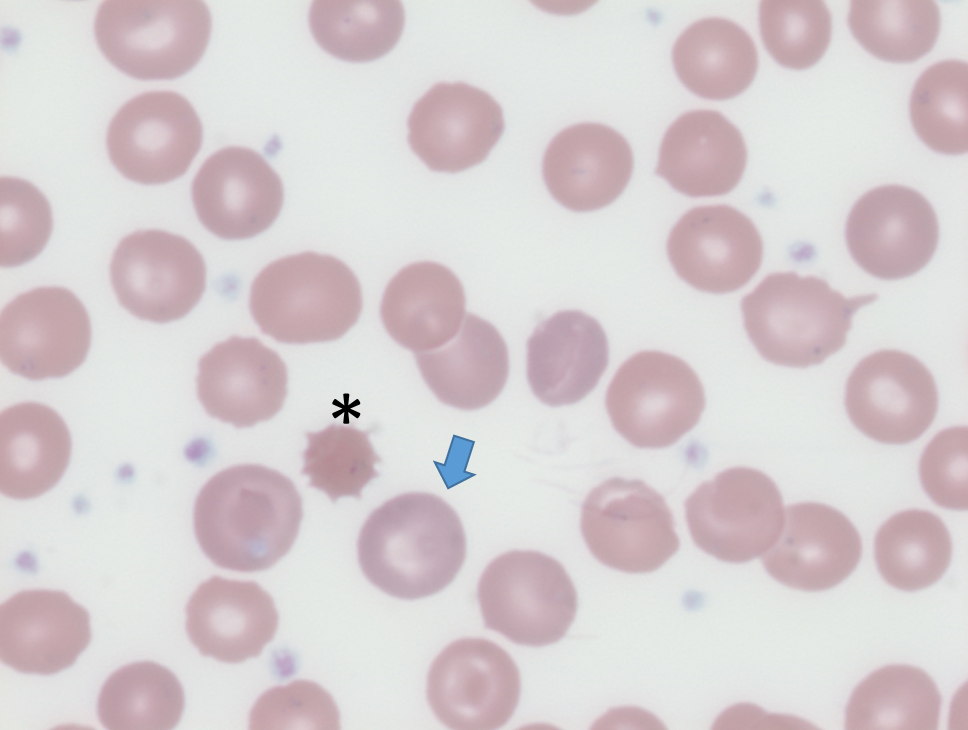
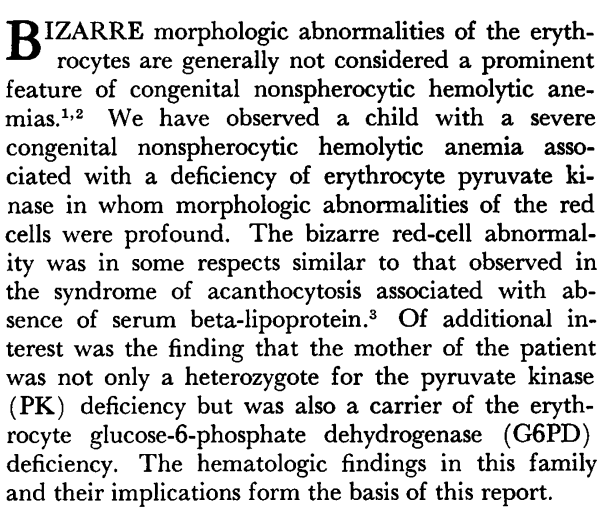
Similar peripheral smear findings were first reported in a New England Journal of Medicine article in 1964, three years after the first description of a case of pyruvate kinase (PK) deficiency:
Post-splenectomy leukocytosis
Chronically high white blood cell counts after splenectomy are frequently observed in both humans and laboratory animals. The long-term effect is more pronounced for lymphocytes and monocytes, compared to neutrophils, which often peak shortly after removal of the spleen and then approach normal values at later stages.
Most of the literature in humans is old. The results below are from a 1968 study which examined pre and post (3 month)-splenectomy white cell counts in a series of patients:
- Without hematological disease (Group A)
- With hereditary spherocytosis or hereditary elliptocytosis (Group B)
- With hereditary non-spherocytic hemolytic anaemia (pyruvate kinase deficiency or glucose-6-phosphate dehydrogenase deficiency) (Group C)
- With miscellaneous hemolytic anemias (Group D)
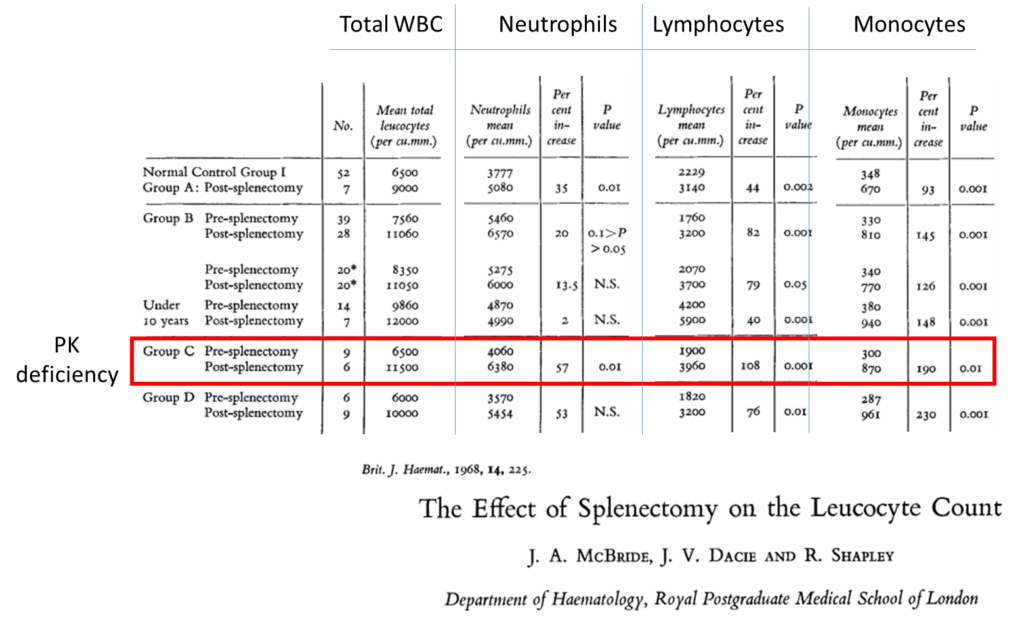
The above study did not report eosinophil or basophil counts, both of which were elevated in our patient.
Post-splenectomy leukocytosis (cont’d)
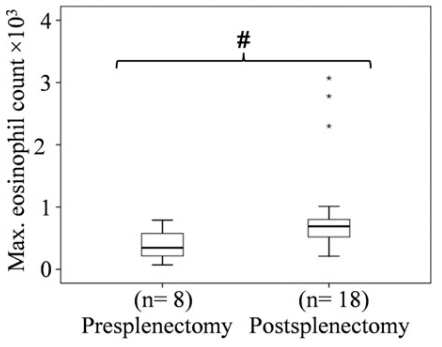
A more recent study showed that splenectomy is indeed associated with elevated eosinophil counts:
- 29 patients who had undergone splenectomy were included in the analysis of pre- and post-splenectomy counts.
- 8/29 (14.6%) had eosinophil values exceeding 1.0 x 10⁹/L (maximum, 3.0 x 10⁹/L).
- These exaggerated responses were observed starting from the perioperative setting up to 5 years later, and were further increased with stress surgery or acute bacterial infections.
There are no studies reporting the association between splenectomy and basophilia, and review articles on basophilia do not refer to splenectomy as a cause. That being said, there was not other obvious explanation for the elevated basophil count in our patient.
In summary, the patient’s white cell count and differential are consistent with his post-splenectomy state.
Here are the patient’s hemolysis indices:
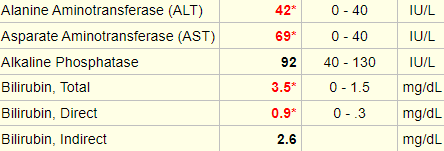

True of false: these results are consistent with hemolysis.
Here are the patient’s hemolytic indices:

Which of the hemolytic markers are released from lysed red cells?
The following are the results of the patient’s iron studies:
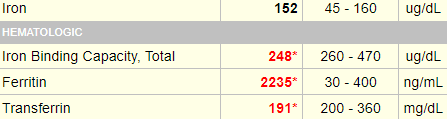
True of false: these results are consistent with iron overload.