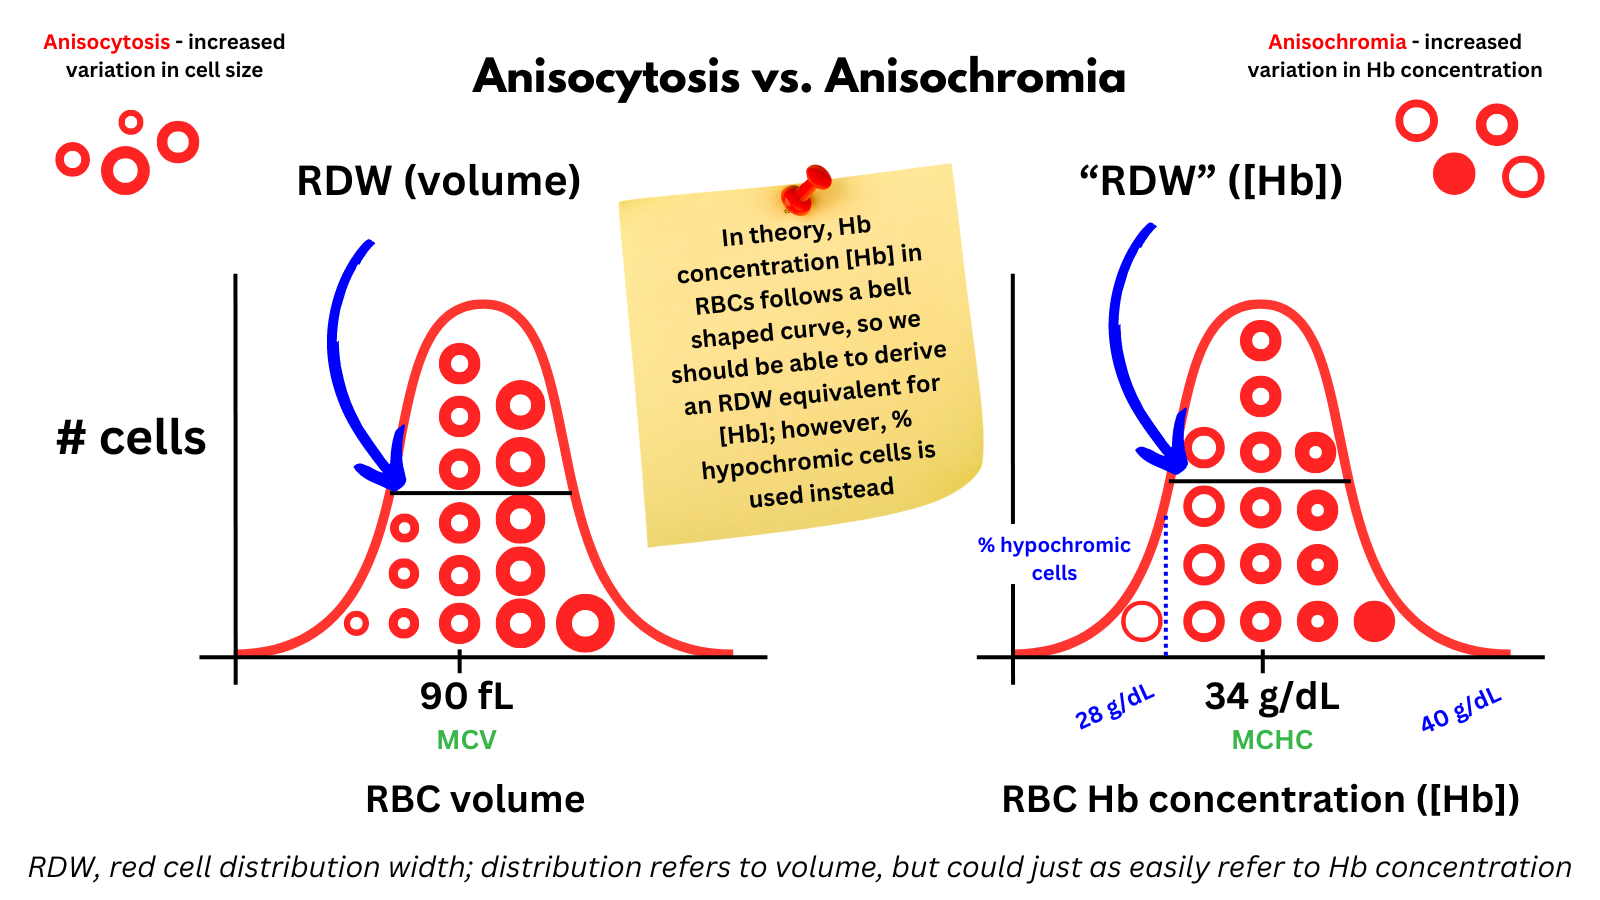
We are used to considering variation in RBC size (increased variation = anisocytosis) by examining a blood smear or evaluating the RDW.
What about variation in RBC Hb concentration ([Hb]) (anisochromia)?1
We can often identify cell-to-cell differences in central pallor on a blood smear. While we may make mental note of such differences, we rarely refer to the finding when summarizing the peripheral smear. And there is no lab equivalent to the RDW for Hb concentration or “chromia”.
Or is there? If we plot single cell [Hb] (which is available with some automated analyzers), we would likely find a normal distribution with a bell shaped curve (I have not seen any such data published). The mean would provide us with the MCHC and the standard deviation with the RDW for [Hb].
The RDW [Hb] might be increased in cases of early iron deficiency or anemia of inflammation, where there is release of poorly hemoglobinized RBCs from the marrow, but not enough to reduce the MCHC.2
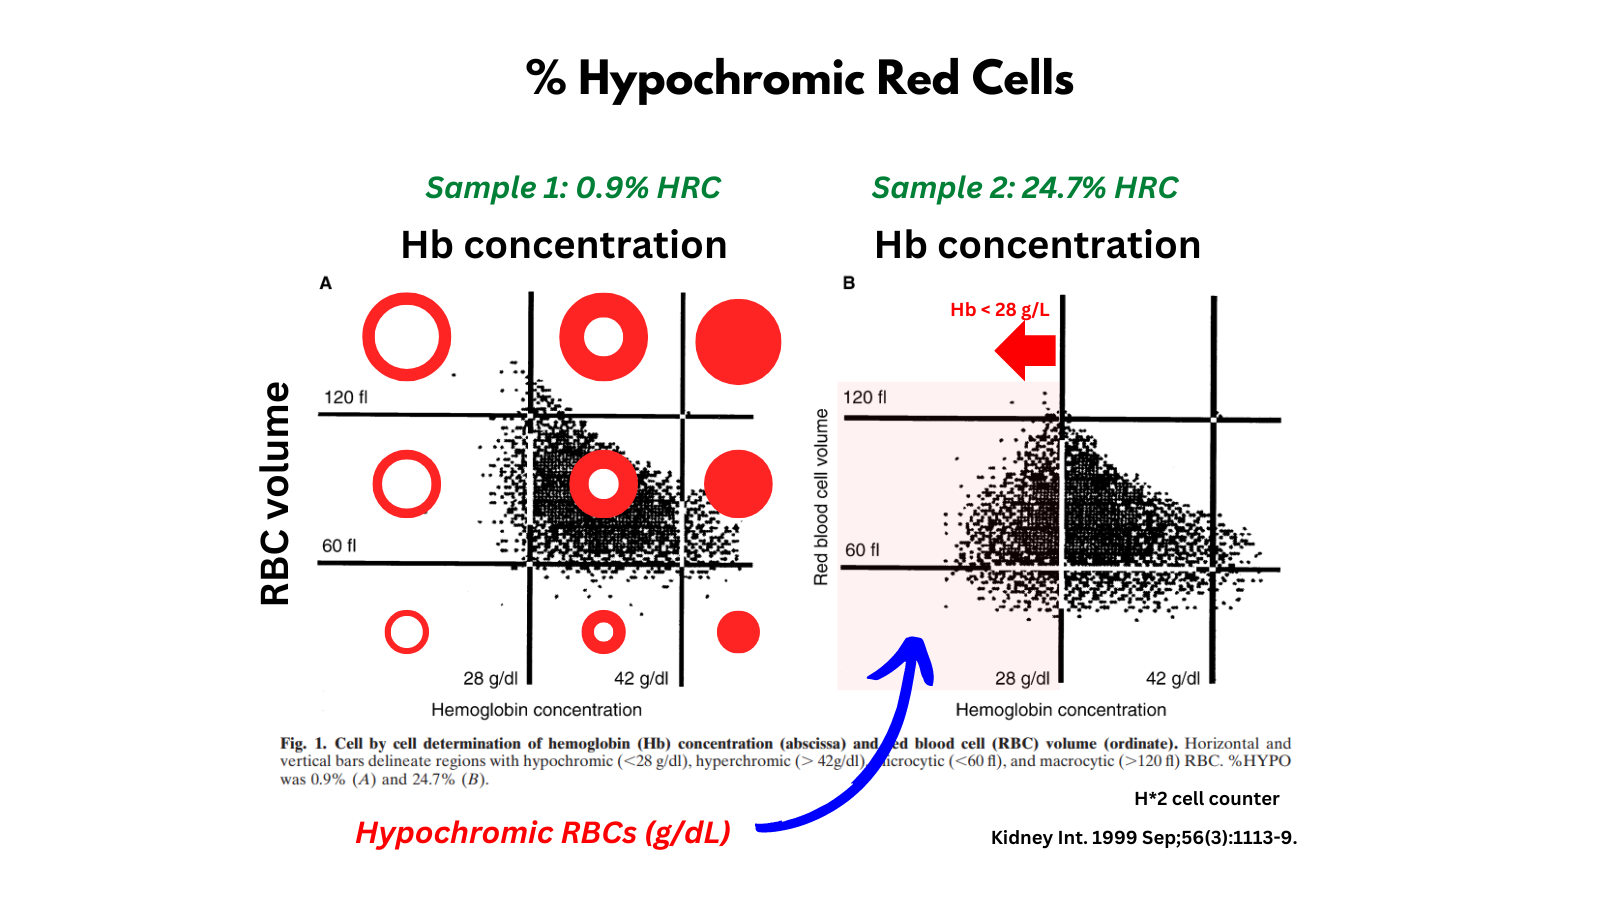
Instead of providing the distribution of [Hb], various automated hematology analyzers have incorporated a parameter that measures % hypochromic cells (< 5% is considered normal).
By analogy, that would be like reporting the % microcytic cells, not the RDW, when describing the volume of RBCs. That would take some getting used to, and quite a bit of information would be “lost” in the process.
NOTE: Sysmex uses the term hypochromia incorrectly to describe a RBC with lower-than-normal weight in Hb (< 17 pg). The other manufacturers use the term correctly to define a RBC with Hb concentration < 280 g/dL.


References:
