
I recently posted a poll asking how often clinicians look at the transferrin level when interpreting iron studies.
At my hospital, the iron panel reports both transferrin and TIBC. In practice, I usually ignore the transferrin and focus on the TIBC and TSAT.
Which made me wonder:
What does transferrin tell us that TIBC does not?
And behind that question was an even more basic one:
What exactly is TIBC?
The minivans and the seats
One way to think about the standard iron panel is to imagine transferrin molecules as minivans traveling on the road.
Each transferrin molecule has two high-affinity iron-binding sites. In our analogy, those are the two seats.
Transferrin tells us how many minivans are on the road.
Serum iron tells us how many seats are occupied across the entire fleet.
UIBC, or unsaturated iron-binding capacity, tells us how many seats are empty across the fleet.
TIBC, or total iron-binding capacity, tells us the total number of seats across the fleet.
And transferrin saturation (TSAT) tells us what percentage of all those seats are occupied.
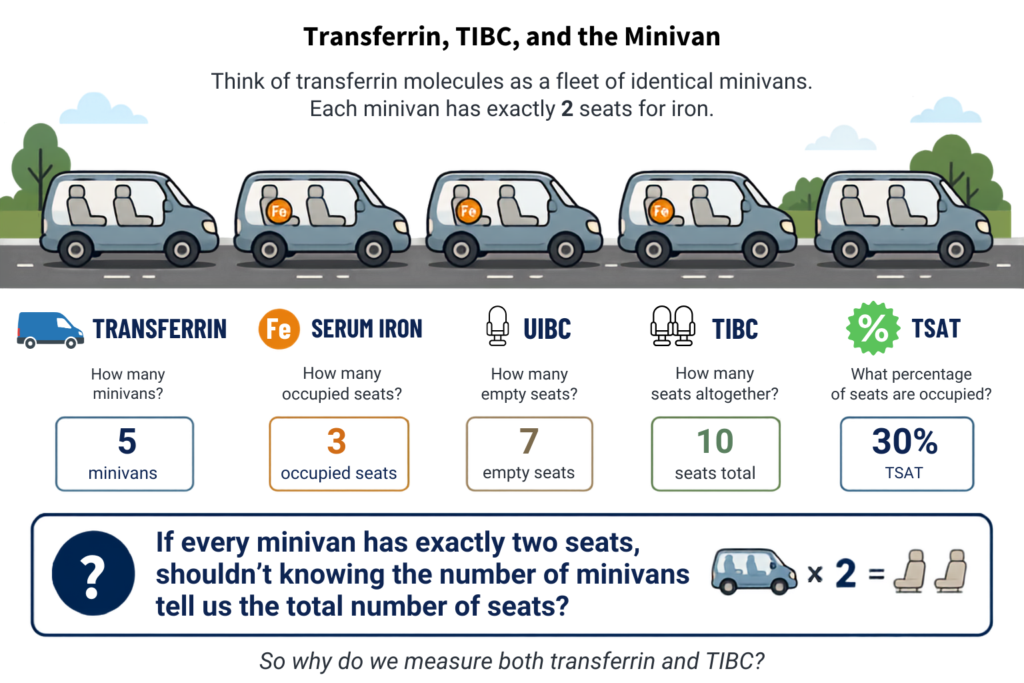
The minivan metaphor makes two familiar relationships immediately intuitive.
TIBC = serum iron + UIBC
Occupied seats + empty seats = total seats.
And:
TSAT = serum iron / TIBC × 100
Occupied seats / total seats × 100 = percentage of seats occupied.
But the analogy also exposes a puzzle.
If transferrin tells us how many minivans are on the road, and every minivan has exactly two seats, shouldn’t knowing the number of minivans also tell us the total number of seats?
In other words:
Shouldn’t transferrin and TIBC be mathematically interchangeable?
In principle, they nearly are. The stoichiometric conversion factor, as we will see, is about 1.40.
But in the clinical laboratory, the relationship is not fixed. Different methods, and different laboratories, can produce different relationships between transferrin and TIBC.
So where does the 1.40 come from, and why doesn’t everyone use it?
THE IRON PANEL, AS MINIVANS
Transferrin = minivans
2 iron-binding sites = 2 seats per minivan
Serum iron = occupied seats
UIBC = empty seats
TIBC = all seats
TSAT = % of seats occupied
Why isn’t the conversion factor fixed
A transferrin molecule has two iron-binding sites.
That means there should be a fixed relationship between the amount of transferrin in plasma and the amount of iron it can bind.
The stoichiometric relationship is approximately:
TIBC (µg/dL) = transferrin (mg/dL) × 1.40
So if the transferrin concentration is 300 mg/dL, its predicted iron-binding capacity is:
300 × 1.40 = 420 µg/dL
Where does the 1.40 come from?
The calculation is shown in the box below.
WHERE DOES 1.40 COME FROM?
It falls directly out of molecular stoichiometry.
Because “one transferrin molecule binds two iron atoms” is a relationship between numbers of molecules, not between grams, we cannot derive the conversion factor by comparing masses alone. We first have to work in moles.
- Molecular mass of transferrin ≈ 79,600 g/mol
- Atomic mass of iron ≈ 55.85 g/mol
- 1 mole of transferrin binds 2 moles of iron
- 2 moles of iron weigh 111.7 g
- Therefore, 79,600 g transferrin binds 111.7 g iron
- Therefore, 1 mg transferrin binds ≈ 1.40 µg iron
TIBC (µg/dL) ≈ transferrin (mg/dL) × 1.40
This is not merely an empirical correlation between two laboratory measurements. The conversion factor follows directly from molecular stoichiometry.
And yet clinical laboratories do not all use 1.40.
When TIBC is derived from transferrin, different laboratories may use different conversion factors, some close to the stoichiometric value and others substantially lower.
So now the puzzle is real:
If the molecular relationship is fixed, why isn’t the laboratory relationship fixed too?
To answer that, we have to look at how laboratories actually obtain TIBC.
How laboratories obtain TIBC
The molecular calculation gives us a theoretical benchmark: transferrin × ~1.40.
But laboratories still need to generate an actual patient TIBC. There are several ways to do that.
1. Saturation-based TIBC
In these methods, excess iron is added to serum to occupy available transferrin-binding sites. The assay then removes, masks, or otherwise distinguishes excess unbound iron and estimates the amount associated with iron-binding capacity.
Conceptually, this comes closest to asking:
How much iron can this sample bind under the assay conditions?
But it is still an assay-defined result. It depends on reagent chemistry, saturation conditions, timing, calibration, and how bound and unbound iron are separated or distinguished.
ONE CLASSICAL SATURATION-BASED TIBC METHOD
- Saturate transferrin with excess iron.
- Remove or distinguish the iron that did not bind.
- Quantify the iron associated with the transferrin-bound fraction.
- Develop color using an iron-sensitive chromogenic reaction.
- Measure the signal spectrophotometrically.
2. UIBC-derived TIBC
Another common approach is to measure serum iron and UIBC.
UIBC asks how much additional iron the serum can bind.
Returning to our minivans:
serum iron = occupied seats
UIBC = empty seats
So:
TIBC = occupied seats + empty seats
or:
TIBC = serum iron + UIBC
But UIBC is itself an assay result. Unlike transferrin-derived TIBC, which is calculated from a single measured analyte, UIBC-derived TIBC is calculated from two separately measured quantities: serum iron and UIBC.
In some method-comparison studies, TIBC calculated from serum iron plus UIBC has been lower than TIBC obtained with saturation-based methods. Proposed contributors include incomplete or kinetically limited iron binding under assay conditions, differences in reagent chemistry and calibration, and propagation of error from two separately measured quantities.
So even something as apparently simple as counting the empty seats depends on how you count them.
HOW IS UIBC MEASURED?
- Add a known excess of iron to the serum.
- Bind some of that iron to the unoccupied sites on transferrin.
- Measure the iron that remains unbound, typically by a colorimetric method.
- Subtract the unbound iron from the amount originally added.
The difference is the UIBC: the amount of iron taken up by previously unoccupied binding sites.
TIBC = serum iron + UIBC
The distinction between the two approaches is simple:
Saturation-based TIBC: fill all the seats, remove the excess iron, then measure the iron that filled those seats.
UIBC: add a known amount of iron and determine how much remains after the vacant transferrin sites have taken up iron. The difference represents the previously unoccupied capacity.
3. Transferrin-derived TIBC
A laboratory can also bypass a binding-capacity assay altogether.
It can measure transferrin immunologically and calculate a TIBC from the transferrin concentration.
At first glance, that sounds straightforward.
If the stoichiometric relationship is about 1.40, simply multiply transferrin by 1.40.
Except that laboratories do not necessarily do that.
Some use empirically derived conversion factors instead.
HOW IS TRANSFERRIN MEASURED?
- Add antibodies that specifically recognize transferrin to the serum sample.
- Form complexes as the antibodies bind transferrin, making the solution increasingly turbid.
- Shine light through the sample and measure how much the antibody–transferrin complexes scatter or reduce transmitted light.
- Calculate the transferrin concentration by comparing the optical signal with a calibrated standard.
More transferrin → more antibody–transferrin complexes → greater turbidity.
This is an immunoturbidimetric measurement of transferrin protein concentration. No iron-binding capacity is being measured.
| How TIBC is obtained | Measured or calculated? | Inputs | What is actually measured? | How does TIBC emerge? |
|---|---|---|---|---|
| Saturation-based TIBC | Assay-estimated | Dedicated binding-capacity assay | Iron associated with binding capacity after saturation | Binding capacity is estimated from the assay |
| UIBC-derived TIBC | Calculated | Serum iron + UIBC | Two separately measured quantities | TIBC = serum iron + UIBC |
| Transferrin-derived TIBC | Calculated | Transferrin alone | Transferrin protein concentration | TIBC = transferrin × conversion factor |
All three can produce a number called TIBC. They do not get there the same way.
Notice that “calculated TIBC” is not synonymous with “transferrin-derived TIBC.” Two of the three routes are calculated: one from serum iron + UIBC, the other from transferrin × a conversion factor.
Do transferrin and TIBC actually track?
So far, we have approached the relationship between transferrin and TIBC from chemistry and laboratory methodology.
But how closely do the two actually track in patients?
Very closely.
And that is not merely what the chemistry predicts.
n a study that combined 570 paired specimens from five correlation studies at three laboratories, investigators measured serum iron, UIBC, and transferrin independently and blindly. TIBC was calculated as serum iron + UIBC and compared with immunologically measured transferrin. After exclusion of three outliers, TIBC and transferrin had an r² of 0.941. The remaining scatter around the regression line was fully accounted for by assay imprecision. When both measurements were assumed precise and unbiased, the relationship approached the value predicted by molecular stoichiometry: a TIBC-to-transferrin ratio equivalent to a conversion factor of roughly 1.40.1
In other words:
So, at least for UIBC-derived TIBC, the close relationship with transferrin is not just theoretical. It can be demonstrated empirically in patient samples.
A later utilization study approached the question from the opposite direction. Rather than asking how closely TIBC corresponds to transferrin, investigators asked how accurately transferrin could be predicted from TIBC in routine clinical practice. Using linear regression, they found that transferrin could be predicted from TIBC alone, or from TIBC plus other iron-study analytes, with a high degree of accuracy. In most cases, directly measured transferrin therefore provided little if any additional diagnostic information when TIBC was already available. The authors concluded that concurrent ordering of the two tests should usually be avoided; a clinical decision-support alert subsequently reduced transferrin utilization across four hospitals.2
That provides an important counterweight to the analytical complexity:
Chemistry says transferrin and TIBC should be closely related. Clinical measurements confirm that they generally are.
The interesting question is why the numerical relationship is not always identical.
A small detective story from my own EHR
At this point, I went back to the laboratory results that had prompted the twitter poll and ultimately this essay.
One patient’s longitudinal record contained several iron panels performed at my hospital.
One showed:
Transferrin = 254 mg/dL
TIBC, calculated = 330 µg/dL
The implied relationship was:
330 / 254 = 1.30
Another showed:
Transferrin = 255 mg/dL
TIBC, calculated = 332 µg/dL
Again:
332 / 255 = 1.30
And another:
Transferrin = 366 mg/dL
TIBC, calculated = 476 µg/dL
Again:
476 / 366 = 1.30
The same relationship appeared repeatedly in results spanning several years.
1.30.
1.30.
1.30.
That would be an extraordinary coincidence.
The obvious hypothesis was that my laboratory’s “TIBC, calculated” was being derived from transferrin using a conversion factor of approximately 1.30.
But the same longitudinal record contained an iron panel from another hospital.
There:
Serum iron = 55 µg/dL
UIBC = 261 µg/dL
TIBC = 316 µg/dL
And:
55 + 261 = 316
That TIBC was completely consistent with the other calculated route:
TIBC = serum iron + UIBC
Same patient. Same general laboratory quantity.
A different path to a number called TIBC.
This was an important caution.
Repeated numerical relationships can strongly suggest how a result was produced, but they do not by themselves establish the laboratory method.
And the label “TIBC, calculated” is not enough.
Reverse engineering can suggest the method.
To know for sure, ask the lab.
The 1.40 versus 1.18 puzzle
Mayo Clinic Laboratories provides a striking documented example.
Mayo measures transferrin immunoturbidimetrically and calculates:
TIBC = transferrin × 1.18
At a transferrin concentration of 300 mg/dL:
Stoichiometric prediction = 420 µg/dL
Mayo-reported TIBC = 354 µg/dL
TWO CONVERSION FACTORS, TWO DIFFERENT ORIGINS
~1.40: Stoichiometric conversion factor
Derived from molecular mass and 2 iron-binding sites per transferrin molecule. It predicts what the relationship should be from chemistry alone.
1.18: Empirical conversion factor
Derived by Mayo from internal laboratory studies. It defines the relationship Mayo uses between measured transferrin and reported TIBC.
The first number is a theoretical reference point, not a competing laboratory result. But the difference raises an obvious question:
Why doesn’t the laboratory calculation use the conversion predicted by molecular stoichiometry?
Here is where things get particularly interesting.
On its current TIBC test page, Mayo explains that TIBC can be estimated from the transferrin concentration using the molecular weight of transferrin and the fact that each transferrin molecule can bind two atoms of iron.
That sounds like the stoichiometric argument we just made.
But farther down the same page, in the method description, Mayo specifies the actual calculation:
TIBC = transferrin × 1.18
The same test page describes the molecular basis of TIBC in stoichiometric terms, while its method section specifies an empirically derived calculation of transferrin × 1.18.
That distinction captures the central point: a reported TIBC is not simply molecular stoichiometry translated into laboratory units. It is also a product of an analytical and reporting method.
Mayo’s 2012 test-change documentation adds an important piece of history. Mayo previously obtained TIBC from serum iron plus UIBC. It then changed to measuring transferrin immunoturbidimetrically and calculating TIBC using the 1.18 factor, which Mayo states was established through internal studies performed from 2010 through 2012. The existing TIBC and percent-saturation reference intervals were retained.3
That chronology is intriguing.
But the public documentation does not tell us why the empirically derived factor landed specifically at 1.18 rather than at the stoichiometric value of approximately 1.40. The internal validation data are not publicly available.
What we can say is simpler and more important:
1.40 describes molecular stoichiometry.
1.18 describes the relationship used by a particular laboratory method.
Those are not necessarily the same thing.
And Mayo is not an isolated example
The relationship between transferrin and reported TIBC varies substantially among laboratories.
In a recent survey of 21 CLIA-certified laboratories, 14 (66%) had different implied transferrin-to-TIBC conversion factors at the lower and upper limits of their reported reference intervals. The implied factors ranged from 0.74 to 1.44 at the lower limit and 1.07 to 1.42 at the upper limit.45
In some laboratories, even the lower and upper ends of the reported intervals do not imply the same transferrin-to-TIBC relationship.
That is remarkable.
We started with a relationship that appears to be fixed by chemistry: two iron-binding sites per transferrin molecule.
Yet in clinical laboratory practice, the relationship between measured transferrin and reported TIBC can vary substantially.
That does not mean the chemistry is variable. It means the laboratory number reflects not only molecular stoichiometry, but also how TIBC is measured or calculated, how the assay is calibrated, and, in some cases, the historical method against which the current result was validated.
It is therefore useful to keep one theoretical benchmark and three laboratory routes separate:
Theoretical benchmark
- Stoichiometric TIBC: the capacity predicted from molecular mass and two iron-binding sites per transferrin molecule
Laboratory routes
- Saturation-based TIBC: an assay-defined estimate of binding capacity under specified laboratory conditions.
- UIBC-derived TIBC: calculated as serum iron + measured UIBC.
- Transferrin-derived TIBC: calculated from measured transferrin using a laboratory-specific conversion factor.
We call all of them TIBC.
They are not necessarily produced in the same way.
Do we need both transferrin and TIBC
For routine assessment of iron status, probably not.
There are two reasons.
First, sometimes they are not independent measurements at all.
If your laboratory reports a transferrin-derived TIBC, it measures transferrin and then calculates TIBC from that measurement using a conversion factor. In that setting, one value is derived directly from the other.
To understand exactly how the two values are related, you need to know the conversion factor used by that laboratory.
Second, even when they are obtained independently, they usually provide substantially overlapping information.
This is the case when TIBC is obtained independently of the transferrin measurement, either with a saturation-based assay or from serum iron plus UIBC.
Now the two measurements are analytically independent. But they still largely interrogate the same biological system.
That is because TIBC is, in large part, a functional reflection of the transferrin concentration.
Transferrin measures the concentration of the major iron-binding protein in plasma.
TIBC estimates the iron-binding capacity attributable predominantly to that protein.
So when transferrin rises, TIBC generally rises. When transferrin falls, TIBC generally falls.
The empirical literature supports this. Paired transferrin and TIBC measurements correlate closely, and concurrent measurement of both generally adds little additional diagnostic information.
So the two reasons are quite different:
Sometimes TIBC and transferrin are redundant by calculation.
Even when they are not, they are usually redundant in the clinical information they provide.
Discordance between independently obtained transferrin and TIBC may occasionally be analytically or biologically interesting, but that is not an established routine diagnostic use..6
So if we do not routinely need both, which should we prefer?
There is no obvious universal answer.
Transferrin has the conceptual advantage of being a direct measurement of the protein itself.
TIBC has the practical advantage of being deeply embedded in clinical iron studies and in the conventional calculation and interpretation of TSAT.
For clinicians accustomed to TIBC, there is no clear reason to abandon it simply because transferrin is the more direct protein measurement. Conversely, if a laboratory reports transferrin rather than TIBC, little clinically relevant information about the transferrin system is necessarily lost.
For routine iron assessment, then, having both usually adds little.
And then there is TSAT
This is where the analytical differences we have been discussing become clinically relevant.
We commonly calculate:
TSAT = serum iron / TIBC × 100
So whatever happens to the denominator propagates directly into the TSAT.
Consider a patient with:
Serum iron = 78 µg/dL
Transferrin = 300 mg/dL
Using the stoichiometric relationship as a theoretical reference:
TIBC equivalent = 300 × 1.40 = 420 µg/dL
and:
TSAT = 78/420 = 18.6%
Using Mayo’s empirically derived factor of 1.18:
TIBC = 300 × 1.18 = 354 µg/dL
and:
TSAT = 78/354 = 22.0%
The 18.6% value is theoretical. It is what the TSAT would be if we converted transferrin to TIBC using the stoichiometric factor of 1.40. Mayo uses 1.18, which yields a TSAT of 22.0%.
But notice where the values land.
They straddle 20%.
And 20% is not just another number. A TSAT around 20% is used as a decision threshold in several iron-restriction frameworks, although no single cutoff has identical meaning across every population, assay, or clinical purpose.
The point is not that Mayo’s TSAT is wrong. A laboratory validates its methods, calculations, and reference intervals as a system.
A cutoff such as 20% looks universal.
The analytical denominator beneath it may not be.
This does not invalidate TSAT. It remains an extremely useful clinical measure.
But TSAT is a calculated ratio, and its denominator may be generated in different ways.
The apparent precision of a TSAT threshold can therefore obscure some analytical complexity underneath it.
What started as a simple question
I began by wondering whether I should pay more attention to transferrin when interpreting iron studies.
I ended up somewhere else.
Transferrin and TIBC may appear as two separate entries on an iron panel.
Sometimes they are independently generated results.
Sometimes TIBC is calculated directly from transferrin.
Sometimes a calculated TIBC comes instead from serum iron plus UIBC.
And TIBC is not a single analyte in the way sodium is a single analyte. It is an operational estimate of iron-binding capacity whose numerical value depends partly on the analytical path used to create it.
Looking back through my own patients’ laboratory results reinforced that point. Even a label such as “TIBC, calculated” did not tell me, by itself, what had been measured and what had been calculated.
So when transferrin and TIBC appear together, perhaps the first question should not be:
Which one should I pay attention to?
It should be:
How did my laboratory get these numbers?
Appendix: What Does This Mean in Practice?
1. If I have ferritin and TSAT, do I need TIBC or transferrin at all?
Sometimes the answer is yes, because the denominator can carry information that TSAT alone does not show.
TSAT is a ratio:
TSAT = serum iron / TIBC × 100
Two patients can therefore have the same TSAT for very different reasons.
For example:
| Patient A | Patient B | |
|---|---|---|
| Serum iron | 60 µg/dL | 30 µg/dL |
| TIBC | 400 µg/dL | 200 µg/dL |
| TSAT | 15% | 15% |
The TSAT is identical, but the physiology may not be.
A high TIBC or transferrin is compatible with, and often supports, uncomplicated iron deficiency.
A low TIBC or transferrin may occur with inflammation because transferrin is a negative acute-phase reactant; it may also fall with impaired hepatic synthesis or protein loss.
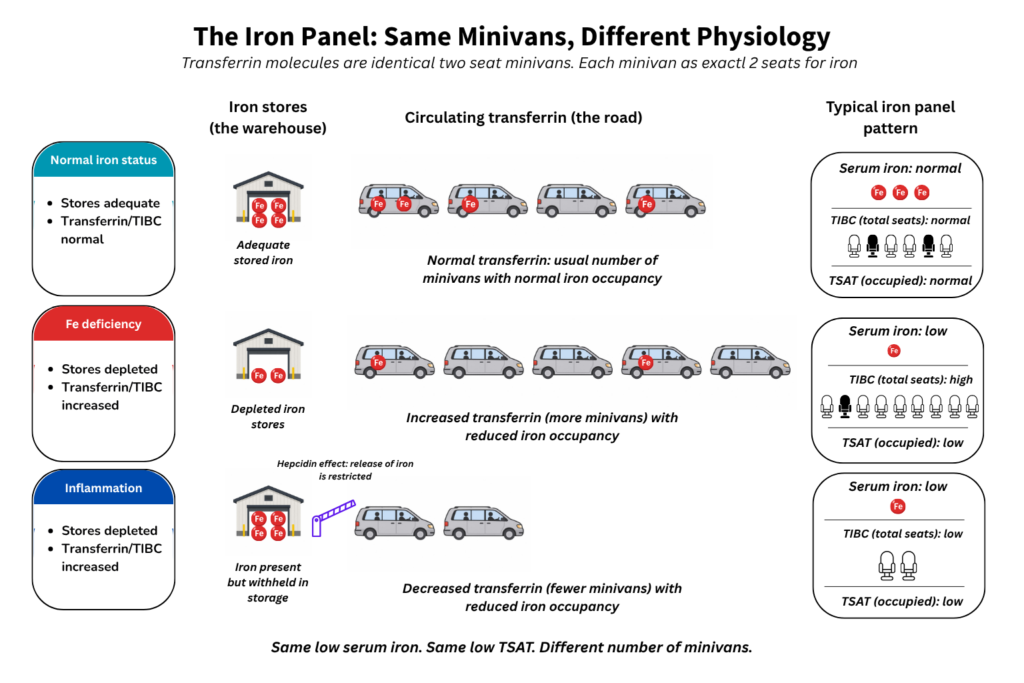
Ferritin adds important context, but ferritin is itself an acute-phase reactant. In settings where ferritin is difficult to interpret, knowing whether the denominator is high or low can be useful.
A ratio can hide physiology that its denominator reveals.
2. What is the best denominator for calculating TSAT?
This is the hardest question.
Molecular chemistry gives us a clear theoretical relationship: each transferrin molecule has two iron-binding sites, corresponding to a stoichiometric conversion factor of approximately 1.40.
But clinical laboratories do not all obtain TIBC in the same way. A reported denominator may come from a saturation-based assay, from serum iron plus UIBC, or from measured transferrin using an empirical conversion factor.
There is a strong conceptual argument for measuring transferrin directly and relating it to its known molecular binding capacity.
But that does not mean a stoichiometrically calculated TSAT should automatically replace the TSAT generated and validated by a particular laboratory.
An empirical factor such as Mayo’s 1.18 should therefore be understood as part of a laboratory reporting system, not as evidence that the molecular iron-binding capacity of transferrin is actually 1.18 rather than approximately 1.40.
So there may not be a universally “best” denominator independent of the assay system and the clinical decision limits developed around it.
TSAT looks like a single number. The denominator underneath it is not generated identically in every laboratory.
I think this version now has the full story in one place without sacrificing the detail that makes the essay worth reading. The one item I would still leave explicitly unresolved is whether the repeated ~1.30 relationship at your own hospital is in fact the documented laboratory formula. The cases are strong enough to present it as the obvious inference, but I would retain “hypothesis” until the lab confirms the method.