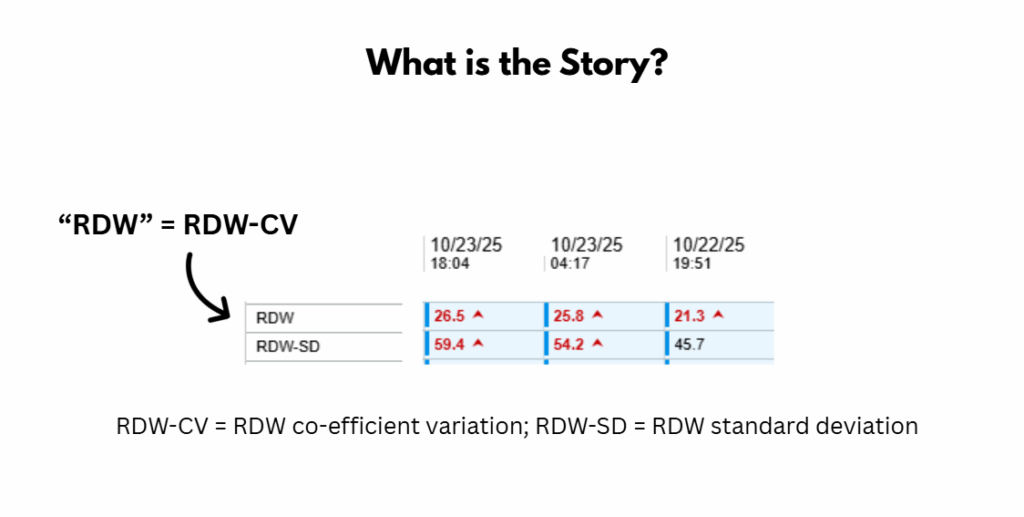
Take a moment to look at the values. How would you describe the pattern? What stands out to you about the change from Day 1 to Day 2?
Interpreting the Indices
Now let us look more closely at what these two RDW measurements represent and how they behave under different physiologic conditions. Although both aim to capture variability in red cell size, they do so in very different ways. Understanding that difference is the key to explaining the pattern in this case.
What RDW-CV Measures
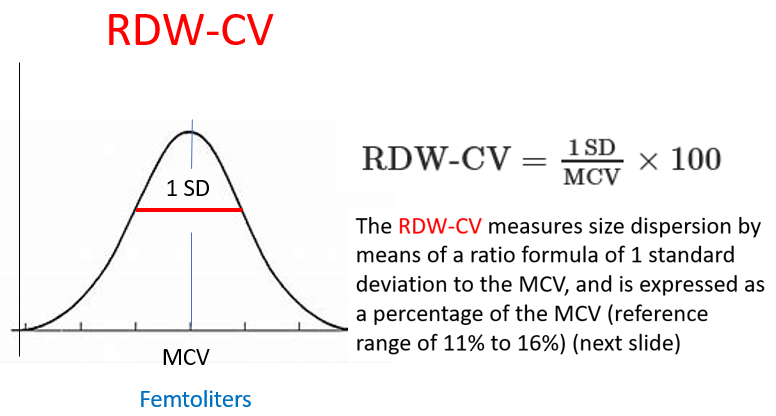
RDW-CV is a calculated value. It equals RDW-SD divided by the MCV, multiplied by 100. Because the denominator contains the MCV, the value is strongly influenced by microcytosis. A very low MCV can make the coefficient of variation appear high, even when the actual spread of red cell sizes is fairly narrow. RDW-CV can therefore exaggerate variability in settings where the cells are uniformly small.
What RDW-SD Measures
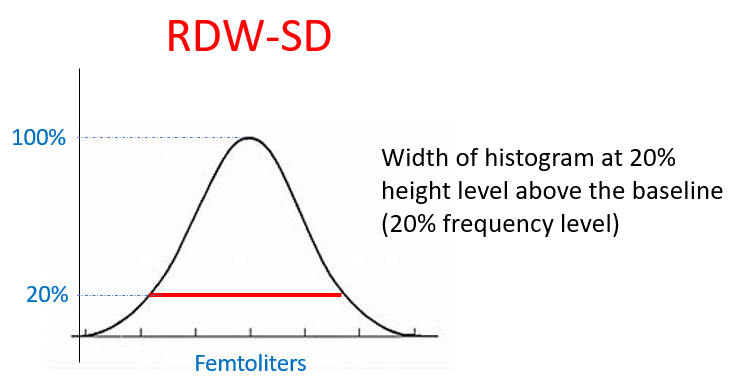
RDW-SD is an absolute measure of the width of the red cell volume histogram at the 20 percent height mark. It does not use any ratios and is not dependent on the MCV. It increases only when the distribution truly widens. RDW-SD is therefore the more reliable index when assessing anisocytosis, because it reflects real differences in cell size rather than mathematical effects created by changes in the mean.
Day 1: Microcytosis With a Narrow Distribution
On the first day, the RDW-CV is elevated, while the RDW-SD is within the reference range. This combination is typical of microcytosis with uniform cell size. The histogram is narrow, but the MCV is small enough that the RDW-CV is inflated. This pattern can occur in thalassemia trait, but it is also seen in severe, longstanding iron deficiency, where the marrow has been producing uniformly small cells for some time. In late iron deficiency, the population becomes relatively homogeneous again, which allows the RDW-SD to remain normal despite marked microcytosis. There is no significant anisocytosis at this point.1
Day 2: A Second Population Appears
On the second day, the RDW-SD increases abruptly from 45.7 to 59.4. This reflects a true widening of the red cell distribution. Physiologic responses such as reticulocytosis after iron therapy or marrow recovery do not produce such a dramatic change within 24 hours. A shift of this size over a single day occurs when a second population of red cells suddenly enters the circulation. The most common and most plausible explanation is transfusion of normal donor red cells into a microcytic host. The mixture of two populations, one microcytic and one normocytic, immediately broadens the histogram.
Putting the Findings Together
The first CBC shows a homogeneous population of small red cells, which explains the normal RDW-SD and the elevated RDW-CV. The second CBC shows the coexistence of two red cell populations, which produces the sudden increase in RDW-SD and the further rise in RDW-CV. This pattern is classic for a microcytic patient who received a red blood cell transfusion between the two samples. In this case, the clinical context confirms severe iron deficiency anemia requiring transfusion, a situation where the pre-transfusion cells are uniformly microcytic and the post-transfusion mixture widens the distribution abruptly. The need for transfusion itself makes thalassemia trait less likely, since uncomplicated trait rarely produces anemia severe enough to require red cell support. The key lesson is that RDW-CV can be misleading when the MCV is low, while RDW-SD more faithfully reflects true anisocytosis. A rapid, one-day increase in RDW-SD should always prompt consideration of transfusion.
Summary
- RDW-CV is a calculated value that becomes distorted when the MCV is low.
- RDW-SD is an absolute measure that reflects true anisocytosis.
- A high RDW-CV with a normal RDW-SD suggests microcytosis with a narrow distribution.
- A rapid, large increase in RDW-SD indicates the sudden appearance of a second cell population.
- The most likely cause of an overnight widening of the histogram is transfusion of donor red cells into a microcytic host.
Teaching Pearl
A sharp, one-day increase in RDW-SD almost always means a second red cell population has entered the circulation; in a microcytic patient, this is usually transfusion.