Note: The video and audio linked above were generated with the assistance of AI. Clinical accuracy has been reviewed, but no AI-generated content can be guaranteed to be fully error-free.
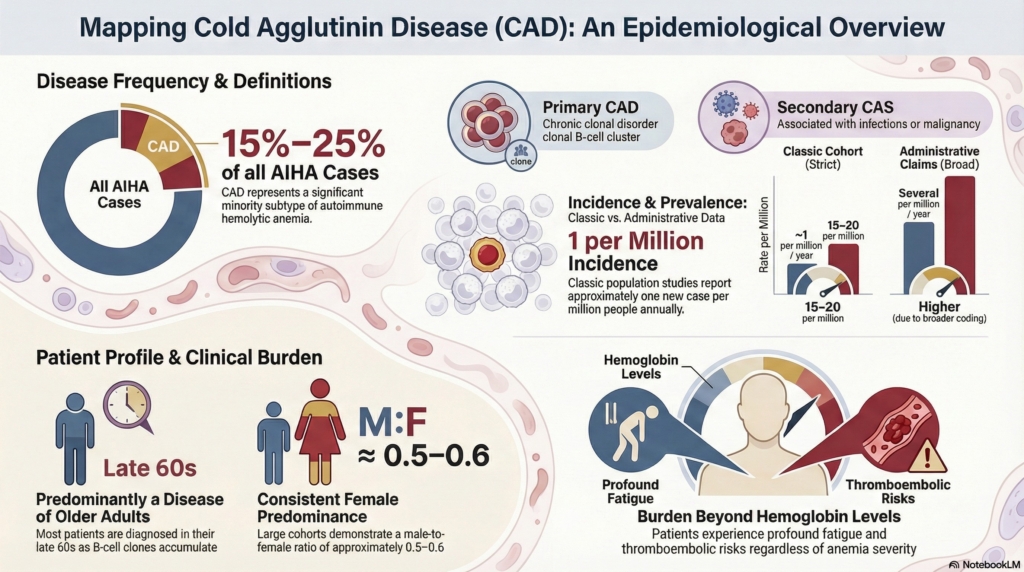
Figure 1. Epidemiologic estimates in CAD depend on definition and data source. Strictly adjudicated cohorts yield lower incidence and prevalence than administrative datasets, reflecting differences in case definition, testing practices, and ascertainment. Demographic patterns, such as older age at presentation and mild female predominance, align with the biology of an indolent clonal B-cell disorder.
Knowing the estimates is useful; understanding how they are generated is essential.
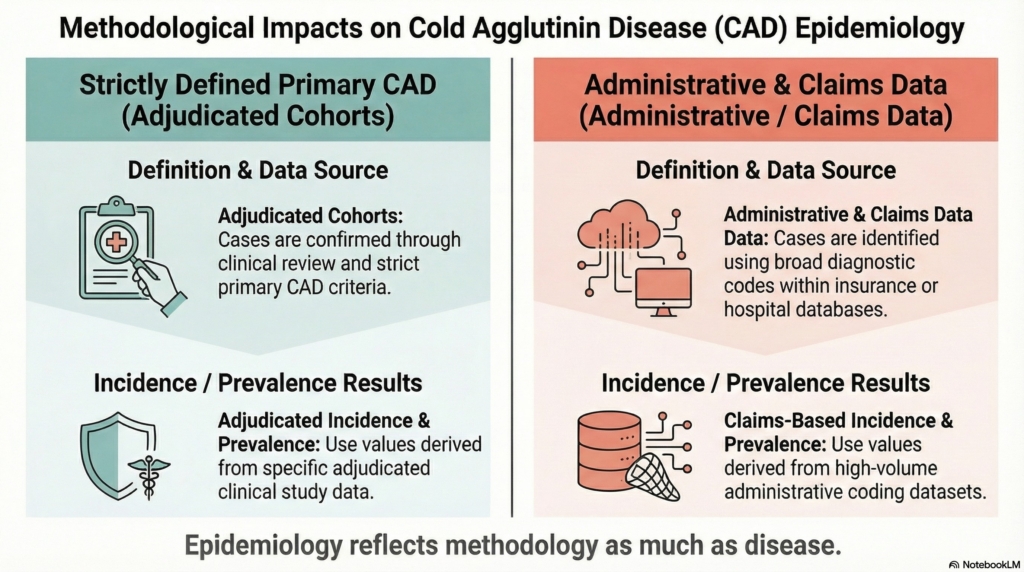
Figure 2. Why epidemiologic estimates differ in cold agglutinin disease. Incidence and prevalence vary depending on how cases are defined and how data are collected. Strictly adjudicated cohorts apply narrow diagnostic criteria and typically yield lower estimates, whereas administrative datasets use broader coding definitions and often produce higher values. The difference reflects methodology as much as disease.
Why CAD epidemiology is harder than it looks
Cold agglutinin disease (CAD) is rare, but estimating how rare depends heavily on definitions and methods. Many datasets cannot cleanly distinguish among several biologically and clinically distinct entities. Administrative datasets, which rely primarily on diagnostic coding rather than adjudicated clinical phenotyping, are particularly vulnerable to this limitation.1The key insight is this: epidemiologic estimates in CAD reflect how cases are defined and detected as much as how often the disease occurs.
Primary chronic CAD vs secondary cold agglutinin syndrome (CAS) Primary CAD refers to a chronic clonal disorder characterized by cold agglutinin–mediated hemolysis, whereas secondary CAS occurs in association with infections or overt malignancy. Older literature and many administrative datasets collapse these entities.2 Clinically, this distinction matters because the epidemiologic profile of primary CAD, typically an indolent clonal disorder of older adults, does not apply to younger patients with infection-related cold agglutinin syndromes, whose evaluation and management follow different logic.
Transient cold agglutinins vs hemolytic disease Low-titer, low–thermal-amplitude cold agglutinins are common, particularly after respiratory infections, and often do not cause sustained hemolysis or anemia.3
True CAD vs mixed autoimmune hemolytic anemia (AIHA) Mixed AIHA is pathobiologically distinct from classic CAD and should be separated from it in rigorously phenotyped cohorts.4
These distinctions matter. Incidence and prevalence estimates vary substantially depending on case definition, testing thresholds, and data source. Administrative datasets, such as insurance claims or billing-code databases, often yield higher rates than adjudicated cohorts, in which cases are individually reviewed and confirmed using prespecified clinical and laboratory criteria. Administrative datasets may reflect coding practices, diagnostic habits, and healthcare utilization as well as underlying disease frequency.5
This is not unique to CAD. It is a general rule of rare-disease epidemiology: the rarer the condition, the more estimates depend on how cases are defined and found. Unless otherwise specified, the estimates below refer to primary chronic CAD with sustained hemolysis and no overt secondary driver.
How common is CAD?
Tier 1 scaffold
CAD is uncommon and represents a minority subtype of autoimmune hemolytic anemia (AIHA).
Key quantitative orientation anchors useful for clinicians:6
CAD accounts for roughly 15%–25% of AIHA.
ncidence is approximately 1 new case per million people per year in classic population-based studies of primary chronic CAD.
In classic population-based studies of primary chronic CAD, incidence is approximately 1 new case per million people per year.
Northern European estimates suggest prevalence around 15–20 per million, although reported ranges span roughly 5–20 per million, reflecting both geographic and methodological differences.
These figures come primarily from clinically characterized cohorts designed to capture primary chronic CAD.
In contrast, contemporary U.S. claims datasets report incidence estimates of 0.6–1.2 per 100,000 personsper year,about an order of magnitude higher than classic cohort estimates.7
Tier 2 nuance
Claims-based analyses consistently yield higher incidence and prevalence estimates than classic cohorts. This difference reflects broader coding definitions, differences in population structure, and incomplete separation of related phenotypes, including secondary cold agglutinin syndromes and mixed autoimmune hemolytic anemia.
At the same time, clinically characterized cohorts are typically small and derived from selected populations, reflecting the rarity of the disease and the practical limits of case ascertainment.8 As a result, even “rigorous” estimates carry uncertainty and may not fully capture the spectrum of disease in the population.
These contrasts underscore a central point: epidemiologic estimates in CAD depend as much on how cases are defined and captured as on how often the disease occurs.
When you encounter a reported incidence, the first question is not “how common is CAD?” but “how was CAD defined in this dataset?”
Most patients present after age 50, commonly in the seventh decade, with median age at diagnosis near the late 60s.10
Age-dependent increases in incidence are particularly evident in population datasets.11
This age distribution is consistent with CAD being associated with an indolent clonal B-cell process.
Sex
A mild female predominance is consistently reported:12
published cohorts report a male:female ratio of roughly 0.5–0.6
This pattern is reproduced in both clinically adjudicated cohorts and administrative data. However, the biological basis for sex distribution in CAD is not well established and may differ from mechanisms proposed for other autoimmune conditions, despite the superficial parallel.
Geography and climate
Temperature exposure is central to symptom expression in CAD, but its relationship to disease occurrence is less clear.
European population-based studies report higher incidence and prevalence in colder regions compared with warmer ones; for example, multinational cohort data show incidence near 1.9 per million per year in Norway versus about 0.5 per million in Italy, with prevalence roughly 20 versus 5 per million.13
In contrast, contemporary datasets do not always demonstrate a consistent geographic gradient despite substantial climatic variation.
These findings raise the possibility that climate influences symptom expression and case detection, although ascertainment and diagnostic thresholds likely also contribute.
Secondary cold agglutinin syndromes and triggers
Cold antibody–mediated hemolysis also occurs secondary to other conditions, including:14
infections, classically Mycoplasma pneumoniae and Epstein–Barr virus
overt lymphoid malignancies, including B-cell lymphomas
The epidemiology of secondary CAS is difficult to quantify. Many cases are transient, under-tested, or inconsistently coded, and most datasets do not reliably separate primary CAD from secondary or mixed forms. Even contemporary epidemiologic datasets that attempt to exclude obvious secondary drivers likely retain substantial residual misclassification.
For clinicians, this uncertainty matters directly: when cold agglutinin–mediated hemolysis is encountered, epidemiologic literature cannot reliably predict how often the presentation represents primary versus secondary disease. Diagnostic evaluation therefore cannot rely on prevalence assumptions alone.
Burden at the population level
Although rare, CAD is not trivial at the population level.
Cohort and registry studies highlight meaningful morbidity.15
Contemporary analyses report signals of increased thromboembolic risk and excess mortality in some populations, although the mechanisms are not defined by epidemiologic data alone.16
Interpretation of these findings depends heavily on case definition, comparator selection, and disease duration, and they are explored in greater depth in the Natural History and Prognosis spokes.
Disease burden is not captured by hemoglobin level alone.17 This reflects disease dimensions outside hemoglobin: cold-induced circulatory symptoms, fatigue disproportionate to anemia severity, behavioral cold avoidance, and cumulative psychosocial burden.
Explicit principle
Numbers measure one dimension of disease; patients live the whole system.
Key Points
case definition matters: epidemiologic estimates depend on how CAD is defined and captured
data source matters: administrative datasets often yield higher rates than adjudicated cohorts
biology shapes demographics: age patterns reflect the underlying clonal biology of primary CAD
numbers are orientation anchors: prevalence figures guide interpretation but are not precise counts
Test your thinking
A short, judgment-focused quiz on epidemiology of cold agglutinin disease.
Key statements in this spoke are grounded in the following evidence:
CAD accounts for approximately 15–25% of AIHA
incidence in classic cohorts ≈ 0.5–1.9 per million/year
prevalence ≈ 5–20 per million in Northern Europe
median age at diagnosis ≈ late 60s
mild female predominance (M:F ~0.5–0.6)
The ranges above reflect the full spread across published studies, whereas single figures cited in the text represent central estimates from rigorously phenotyped cohorts.
Sources supporting these statements: Berentsen S et al. Cold agglutinin disease revisited. Blood. 2020; Blood. 2020;136:480; Blood Adv. 2019;3:2980; Gertz MA. Cold autoimmune hemolytic anemia. Hematol Oncol Clin North Am. 2022.