Overview
- Modern analyzers use a combination of multiple techniques for cell counting and differentiation; however, the Coulter principle is still used in some manner by most analyzers.
Manual
- Prior to the introduction of automated counters, white blood cells were enumerated using a hemocytometer and a blood sample in which blood cells were first lysed.
Electrical impedance
- The Coulter principle relies on electrical impedance to count, size and sort cells.
- Cells are nonconductive and produce measurable changes in electrical resistance in a conducting solution.
- For WBC counting, the sample is incubated with lysing agent to remove red blood cells.
- The remaining specimen is diluted in an electrolyte solution that is conductive, is subject to a low-voltage direct current and is then is drawn through an aperture positioned between the 2 electrodes.
- As cells pass through the aperture, changes in electrical resistance are measured as a voltage pulse:
- The number of pulses corresponds to the number of cells
- The height of each pulse is proportional to the volume of the cell.
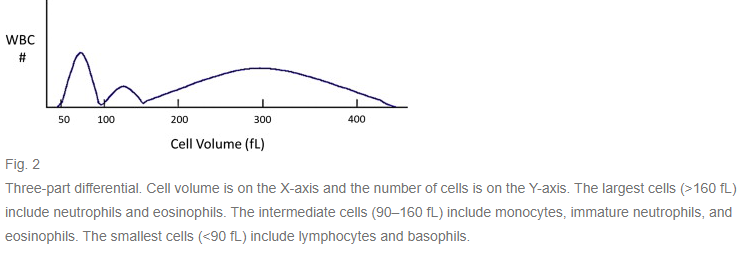
- The resulting data are plotted on a volume distribution histogram (number of cells on the y axis, cell volumes on the x axis). Predetermined volume thresholds are used to generate a total white blood cell count.
- in early automated instruments, more granular separation of thresholds in cell volume ranges were used to generate a 3-part differential based on cell size:
- The largest size group (>160 fL) includes mature and band neutrophils and eosinophils.
- The intermediate size group (90–160 fL) includes monocytes, immature and mononuclear neutrophils, and eosinophils.
- The smallest size group (<90 fL) includes lymphocytes and basophils. nRBCs are also included in this group.
Light scattering
- Laser light scattering techniques (similar to multiparameter flow cytometry) provide information about cell size and structure.
- A flow cell detector is used to analyze light scattering produced as blood cells pass through a laser.
- Recording the number of times the laser is interrupted provides the cell count.
- The amount and angle of scatter is used to classify cells by:
- Size
- Refractive index
- Nuclear features
- Cytoplasmic granularity
- Shape of the cell
- Multiple angles of scatter are measured:
- Forward scatter, or 0°, corresponds to cell size.
- Side scatter of 10° corresponds to internal complexity.
- A scatter of 90° corresponds to cytoplasmic granularity. Eosinophils show a characteristic depolarized 90° scatter due refraction by their crystalline granules.
- In addition to classifying the 5 normal subtypes of WBCs, light scatter techniques give characteristic histogram findings for abnormal and immature cells.
Fluorescent Labeling
- Basic light scattering techniques can be augmented by the use of fluorescent dyes.
- These dyes stain certain cell structures.
- As the cells pass through the laser, the dyes emit specific wavelengths of light depending on the fluorochrome, which can be measured.
- RNA and DNA dyes, such as propidium iodide (PI) or polymethine dyes, are commonly used and can separate nRBCs and reticulocytes from WBCs and also give information about cell viability. PI binds to double-stranded DNA and cannot pass through the membrane of viable cells. If the cells fluoresce with PI, membrane compromise and nonviability are indicated.
- Cells are separated according to their side scatter and fluorescence emission characteristics to determine the cell type.

From Sysmex website:
- Analyzing white blood cell (WBC) differentials on Sysmex’s hematology analyzers consists of a cytochemical reaction of the cells with specific, proprietary reagents, followed by fluorescence flow cytometric analysis.
- The WBC differential application uses information from two analysis channels (WDF and WNR) and provides absolute and percentage counts of the WBC subpopulations NEUT, LYMPH, MONO, EO, BASO and immature granulocytes (IG), and flag information in cases of abnormalities, so that abnormal blood count results can be detected.
- Cytochemical reaction:
- The specially developed lysis reagent initially perforates the cell membranes while leaving the cells largely intact.
- The fluorescence marker then labels the intracellular nucleic acids (mostly RNA).
- The composition of these two reagents effects a mild reaction with the white blood cells so that almost all of their cellular structure remains intact. This means that optimal separation of the WBC subpopulations is achieved.
- fluorescence flow cytometric analysis:
- The sample is then analysed using fluorescence flow cytometry.
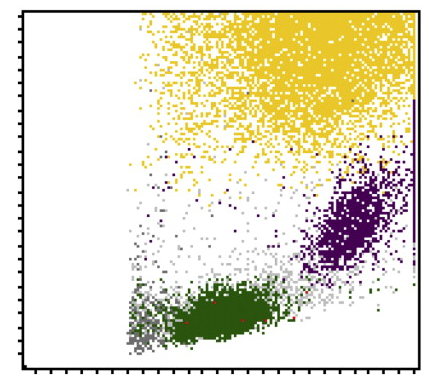
- The measurement signals related to forward scatter (FSC), side scatter (SSC) and side fluorescence (SFL) are analysed and depicted in different two-axis scattergrams, or alternatively in a 3D scattergram (XR-Series only).
- Cells with similar cytochemical properties fall within the same area in the scattergram and can be separated using an advanced software algorithm.
- The combined information about membrane composition and cytoplasmic RNA (fluorescence), cell size (forward scatter) and intracellular structure (side scatter) is analysed with proprietary algorithms that deliver sensitive detection of reactive, immature or pathological cells in a blood sample

Reference: Clin Lab Med. 2015 Mar;35(1):11-24.