Labs

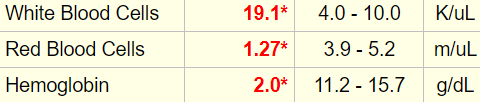
The following is the patient’s complete blood count (CBC) at the time of admission:
| WBC (109/L) | Hb (g/dL) | MCV (fL) | PLT (109/L) |
|---|---|---|---|
| 19.1 | 2.0 | 63 | 211 |
What’s what: WBC, white blood cell count; Hb, hemoglobin; MCV, mean cell volume; MCHC, mean cellular hemoglobin concentration; RDW-SD, red cell distribution width-standard deviation; platelets, PLT; Normal values: WBC 5-10 x 109/L, RBC 4-6 x 10¹²/L, Hb 12-16 g/dL, Hct 35-47%, MCV 80-100 fL, MCHC 32-36 g/dL, RDW-SD < 45 fL, platelets (PLT) 150-450 x 109/L
Seeing is believing! Here is the original lab result:
The Hct was indeed > 6%:
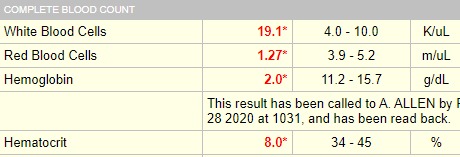
This is a violation of the 3:1 rule which states that the Hct = Hb x 3 (for example, 45% = 15 g/dL x 3). This rule only applies if the MCHC is normal.
MCHC = Hb/Hct
A rule violation can be leveraged for diagnostic gain. Hct:Hb ratio > 3 indicates a low MCHC, usually from iron deficiency.
Note how the MCH tracks with the MCV and the MCHC. It adds little useful information above and beyond the MCV and MCHC. With rare exceptions the MCH can be ignored.
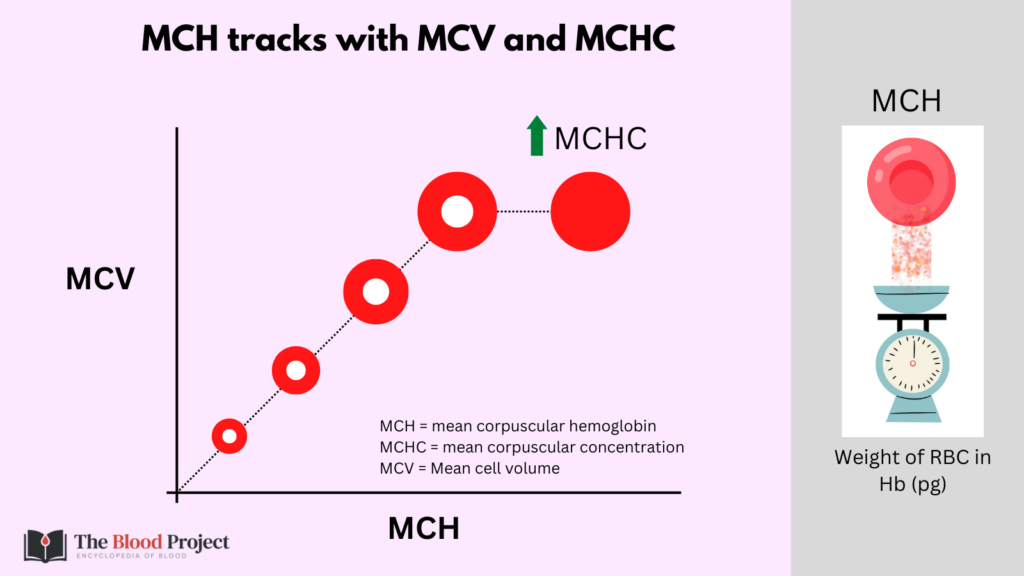
Note how the morphological classification of anemia includes the mean cell volume (MCV) and mean corpuscular hemoglobin concentration (MCHC), but not the mean corpuscular hemoglobin.

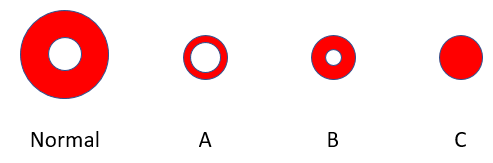
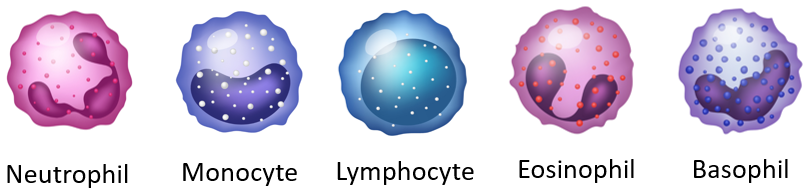
Which red cell belongs to the patient?
The “equation of life”
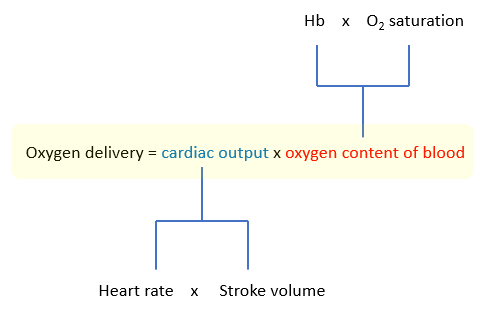
In anemia, the O2 carrying capacity is decreased but tissue oxygenation is preserved at hemoglobins well below 10 g/dL. How is it possible for a patient to live, let alone be awake and conversant, with 1/7th normal oxygen content in their blood (as in this case), when such a drop in cardiac output would be universally fatal (think about it: an ejection fraction of 50% is normal, while one of 35% – less that a 50% reduction – is associated with severe life-threatening heart failure)? According to the formula above, they should both affect oxygen delivery equally.
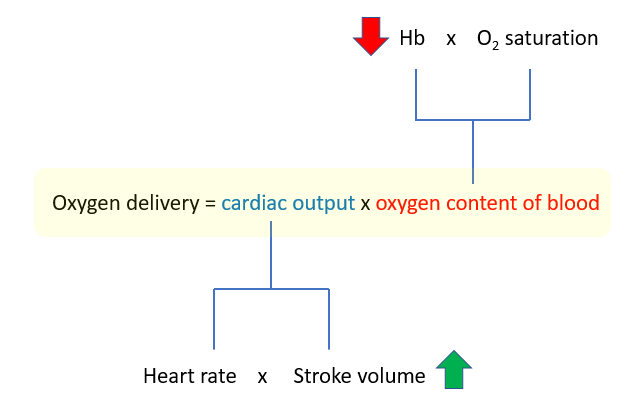
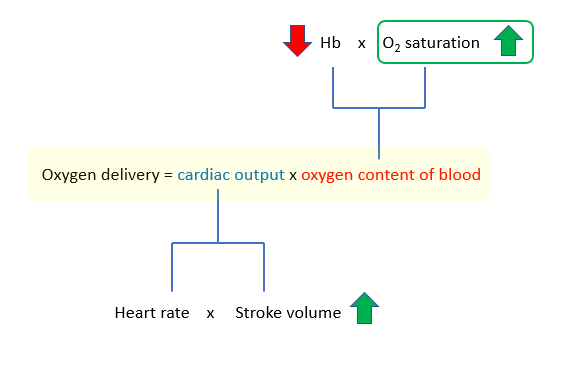
The “equation of life”
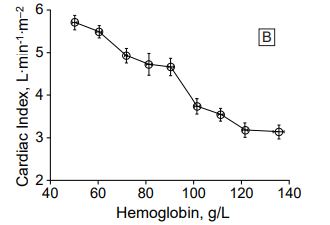
Cardiovascular compensation in severe chronic anemia:
- Oxygen content of blood falls
- Cardiac output increases to maintain oxygen delivery
There are only two ways to increase the cardiac output:
- Increased heart rate
- Increased stroke volume
What do you predict increases in severe chronic anemia: heart rate and/or stroke volume?
Click for AnswerChronic severe anemia and heart rate
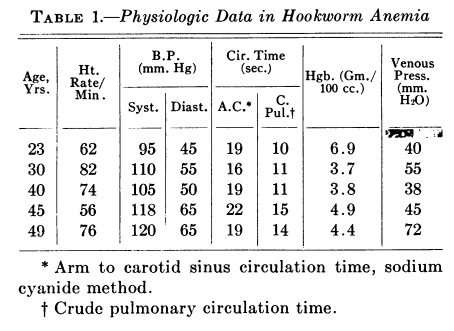
Recall from the Physical Exam that our patient presented with a heart rate of 95/min. If cardiovascular adaptation occurs in severe anemia, then why did our patient not have tachycardia? Because heart rate contributes little to the increase in cardiac output in severe chronic isovolemic anemia. The following table shows a collection of patients with severe chronic anemia from the same institution as the patient we are considering in this case, and their accompanying heart rate when they presented to the Emergency Department. Note that most patients were not tachycardic.
| Patient | Hemoglobin concentration (g/dL) | Heart rate (per minute) |
|---|---|---|
| 1 | 2.6 | 109 |
| 2 | 4.1 | 78 |
| 3 | 5.1 | 73 |
| 4 | 4.5 | 106 |
| 5 | 3.2 | 87 |
| 6 | 4.5 | 87 |
| 7 | 4.4 | 75 |
The notable lack of heart rate response in chronic severe anemia is well documented in the literature. It has been hypothesized that an increased heart rate in the setting of chronic anemia would be maladaptive because it would inhibit coronary blood flow by shortening diastole when the left ventricular myocardium is perfused (shortening of diastolic filling time).
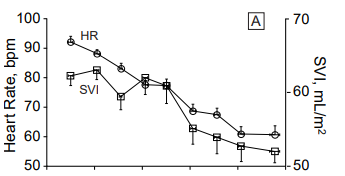
Chronic severe anemia and stroke volume
How does stroke volume increase in anemia? There are several proposed mechanisms:
- Reduced blood viscosity, which:
- Increases preload
- Decreases afterload
- Increased sympathetic stimulation of cardiovascular effectors, though with no or little effect on heart rate.
Of these adaptations, the effect of reduced viscosity is believed to be the most important in chronic severe anemia.
Surprisingly, the patient’s serum lactate was normal when she arrived to the Emergency Department.
All of this speaks to the remarkable compensatory mechanisms in severe chronic anemia.
What other compensatory mechanism might increase oxygen utilization in chronic severe anemia?
Click for AnswerChronic severe anemia and the oxygen dissociation curve
The oxyhemoglobin dissociation curve shifts to the right in chronic severe anemia. How does that improve oxygen delivery? Where is that accounted for in our equation of life?
The answer is that it is not accounted for in the above equation. The equation as it is written describes the flow or delivery of oxygen to microvascular beds. It does not speak to the efficiency of oxygen extraction from hemoglobin. To capture that component, we need another equation:
Oxygen consumption = Arterial oxygen – venous oxygen
A change in the oxygen dissociation curve will affect oxygen unloading in tissues and therefore oxygen utilization/consumption, as will the ability of mitochondria to use the oxygen that diffuses into cells. If oxygen needs are not met by oxygen consumption, tissues start to use anaerobic metabolism and lactic acid builds up in the blood. As we saw earlier, this patient’s lactate was normal, indicating that she was meeting her oxygen needs via various compensatory mechanisms, presumably with increased stroke volume and a shift of the oxygen dissociation curve to the right.
There are two more adaptations we need to discuss in chronic severe anemia:
1. Increased vital capacity of the lungs, which optimizes arterial oxygen saturation
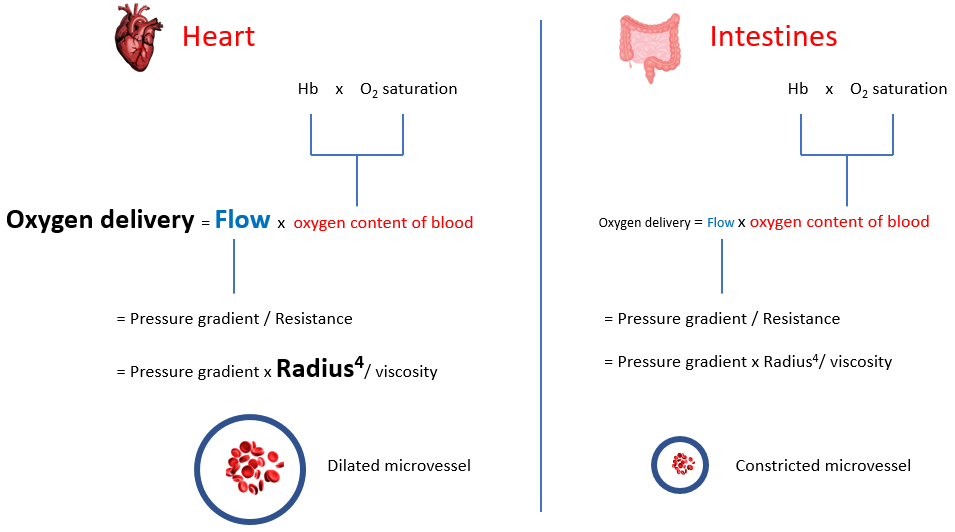
2. Shunting of blood to vital organs
Increased sympathetic tone in anemia results in diversion of blood flow away from the splanchnic, skeletal and cutaneous circulation toward the coronary and cerebral circulation. Selective shunting of blood serves to preserve oxygen delivery to critical organs (tissue hypoxia occurs in a hierarchical manner wherein organs that are critically important for survival). To appreciate this compensation, we need to provide each organ with its own “Equation of life”, as organs negotiate to serve their own needs while serving the larger good of the organism. In the global equation of life, we defined blood flow (or cardiac output) as heart rate x stroke volume. We can also define it according to Poiseuille’s equation:
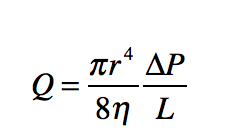
Here, flow is directly proportional to the radius of the blood vessel (to the power of 4) and the pressure gradient and inversely correlated with blood viscosity. When viewed from the perspective of the entire cardiovascular system, blood flow represents cardiac output and the pressure gradient is the mean arterial pressure. However, the parameters of the whole system represent the sum of hemodynamic parameters of each and every tissue, where flow is the amount of blood entering that organ, and the pressure gradient is the difference between arterial and venous pressures in that tissue. Each tissue regulates its own blood flow, primarily be regulating the degree of vasoconstriction/vasodilation (i.e., the “radius” of the microvasculature).
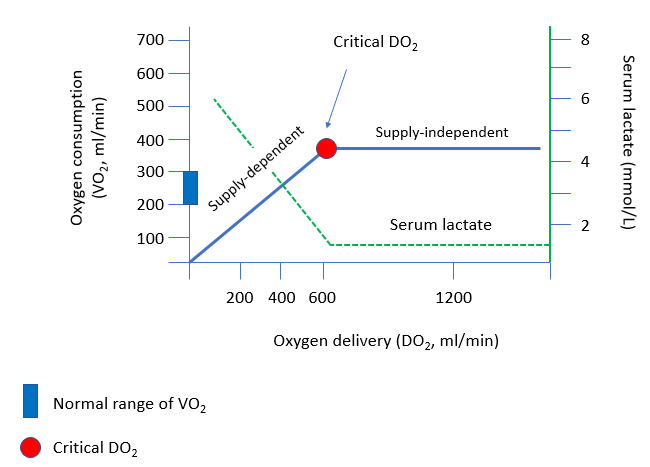
One more useful physiological concept to consider: critical oxygen delivery
The “critical” level of oxygen delivery (DO2) is the value below which DO2 fails to satisfy the metabolic need for oxygen.
Let’s look at some numbers:
Oxygen delivery = cardiac output x oxygen content of blood
Under normal conditions:
Assume:
- Hb 15 g/dL
- Oxygen saturation 99%
- Cardiac output 5 L/min
Oxygen delivery = 5 L/min x (1.39 x .99 x 15 g/dL) = 2064 ml/min, which is 2-4 x the amount of oxygen utilized.
In our patient:
Labs showed:
- Hb 2 g/dL
- Oxygen saturation 95%
Let’s assume normal cardiac output of 5 L/min (this was undoubtedly higher given expected cardiac compensation).
Oxygen delivery = 5 L/min x (1.39 x .95 x 2 g/dL) = 264 ml/min, which places the patient on the supply-dependent part of the curve. There is no safety net: any further reduction in oxygen delivery will have a negative impact on oxygen consumption, and result in anaerobic metabolism with lactic acid production.
To remind you, the patient has significant leukocytosis.
| WBC (109/L) | Hb (g/dL) | MCV (fL) | MCHC (g/dL) | PLT (109/L) |
|---|---|---|---|---|
| 19.1 | 2.0 | 63 | 25.0 | 211 |
What’s what: WBC, white blood cell count; Hb, hemoglobin; MCV, mean cell volume; MCHC, mean cellular hemoglobin concentration; RDW-SD, red cell distribution width-standard deviation; platelets, PLT; Normal values: WBC 5-10 x 109/L, RBC 4-6 x 10¹²/L, Hb 12-16 g/dL, Hct 35-47%, MCV 80-100 fL, MCHC 32-36 g/dL, RDW-SD < 45 fL, platelets (PLT) 150-450 x 109/L
The white cell differential is shown here:
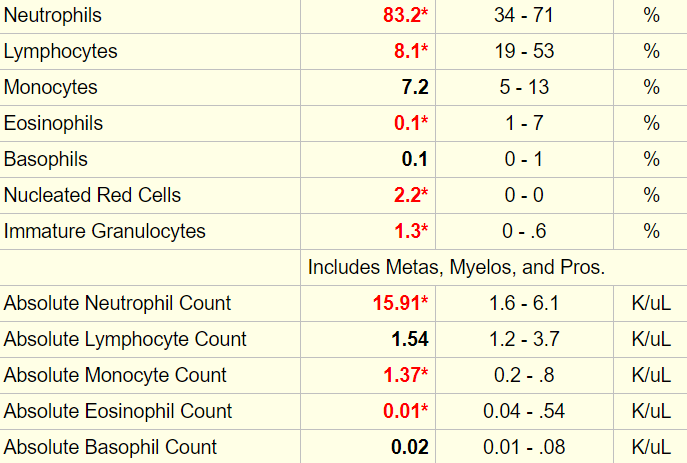
Let’s look at our cheat sheet:
| White cell subset | Cytosis (increased) | Cytopenia (decreased) |
|---|---|---|
| Total white cells | >11 x 109/L | <4.4 x 10⁹/L |
| Neutrophils | >7.7 x 10⁹/L | <1.5 x 10⁹/L |
| Lymphocytes | >3.5 x 10⁹/L | <1.5 x 10⁹/L |
| Monocytes | >0.8 x 10⁹/L | <0.2 x 10⁹/L |
| Eosinophils | >0.35 x 10⁹/L | <0.04 x 10⁹/L |
| Basophils | >0.1 x 10⁹/L | <0.01 x 10⁹/L |