Labs

The following is the patient’s complete blood count (CBC) 4 days prior to admission and on the day of admission:
| Day | WBC (109/L) | Hb (g/dL) | MCV (fL) | PLT (109/L) |
|---|---|---|---|---|
| Day of admission | 2.1 | 6.9 | 100 | 287 |
| 4 days before admission | 5.4 | 9.0 | 95 | 237 |
What’s what: WBC, white blood cell count; Hb, hemoglobin; MCV, mean cell volume; MCHC, mean cellular hemoglobin concentration; RDW-SD, red cell distribution width-standard deviation; platelets, PLT; Normal values: WBC 5-10 x 109/L, RBC 4-6 x 10¹²/L, Hb 12-16 g/dL, Hct 35-47%, MCV 80-100 fL, MCHC 32-36 g/dL, RDW-SD < 45 fL, platelets (PLT) 150-450 x 109/L
Reticulocyte count on day of admission:
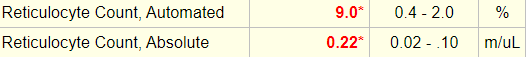
The reticulocyte count is reported as 9%… 9% of what?
Correct. In fact with the absolute reticulocyte count, you could calculate the total red cell count: 0.09 x RBC count = 220 x 109/L. Thus, RBC count = 220×109/L/0.09 = 2.4 x 10¹²/L (that is, 2.4 trillion red cells per liter of blood).
Reticulocyte count on day of admission:
The absolute reticulocyte count is reported as 0.22 m/ul or 220 x 109/L? The patient’s reticulocyte count is similar to which other blood count?
Correct. A normal platelet count is 150-450 x 109/L.
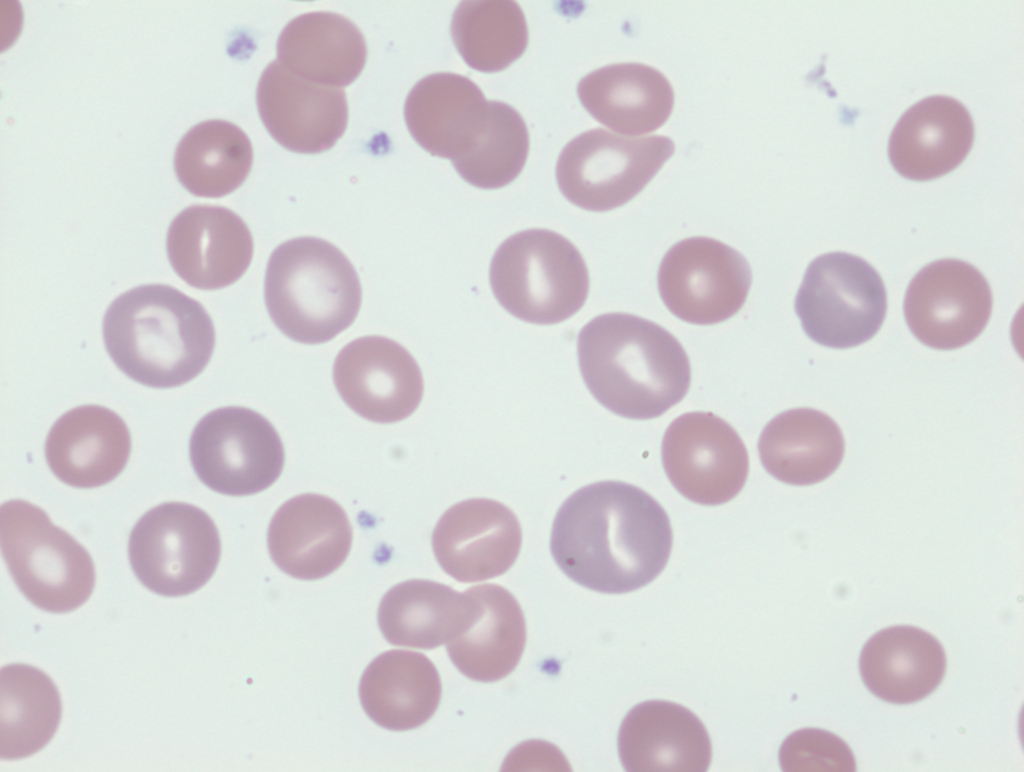
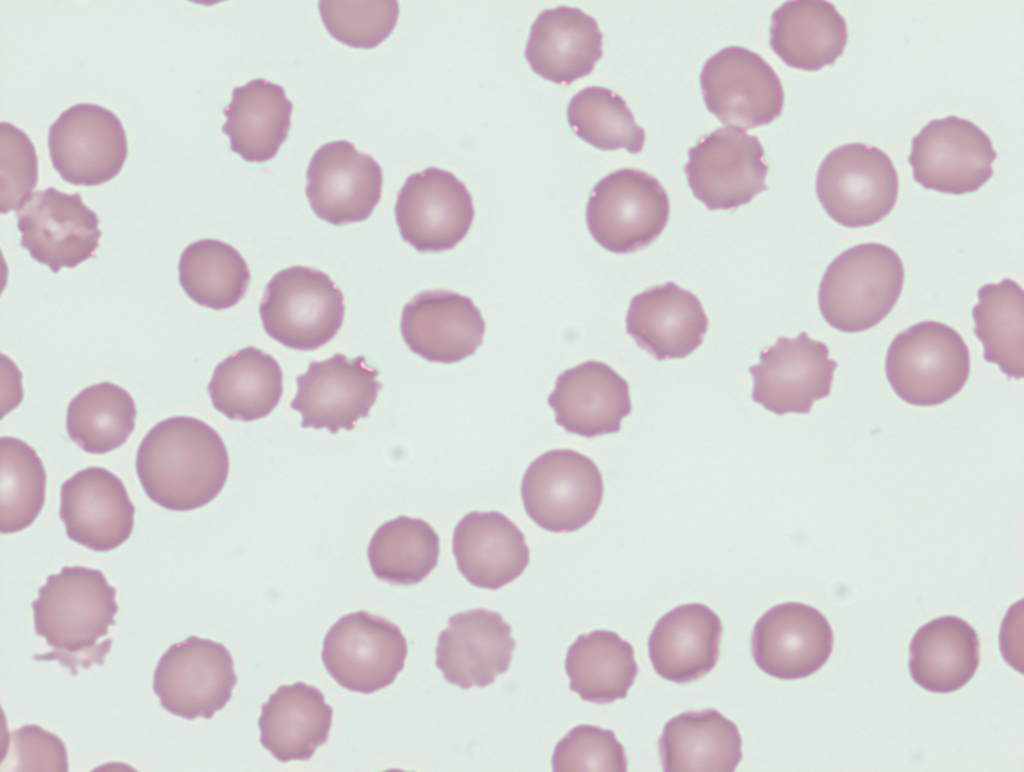
Which peripheral smear would most closely resemble the patient’s?
Let’s look at how a PT and aPTT are carried out:
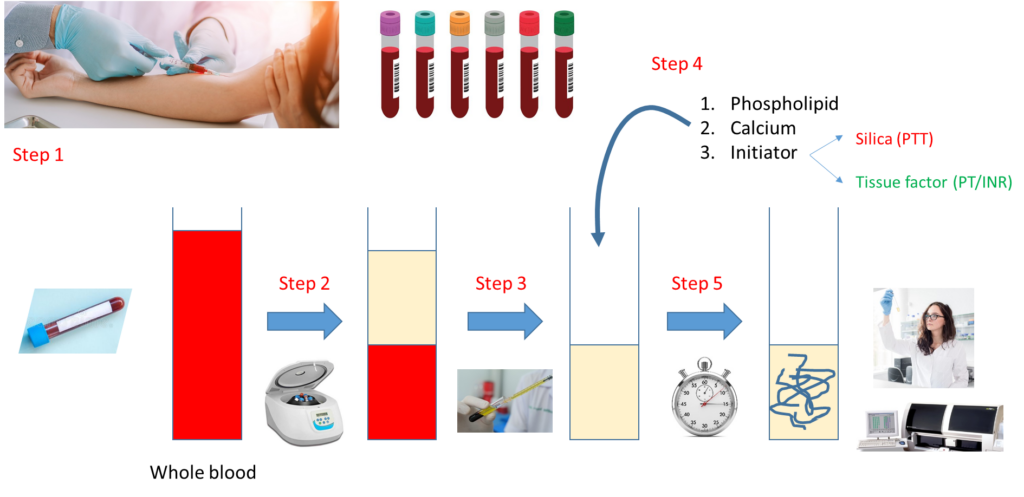
Notes:
- Step 1 – Draw whole blood from a blood vessel (typically an arm vein) into a blue top tube containing the anticoagulant, sodium citrate.
- Step 2 – Spin the liquid blood sample in a centrifuge so that red cells layer on the bottom, plasma on the top.
- Step 3 – Pipette plasma (top layer) into a clean, empty test tube.
- Step 4 – Add phospholipid, calcium and activator (tissue factor for PT, silica for aPTT).
- Step 5 – Incubate at 37 degrees C and measure time to clot formation, either with automated instrument or more rarely by vision.
Note that the major difference between the PT and aPTT is the nature of the activator added to the sample.
Further work-up of this case requires some knowledge of the clotting cascade. Let’s review the basics:
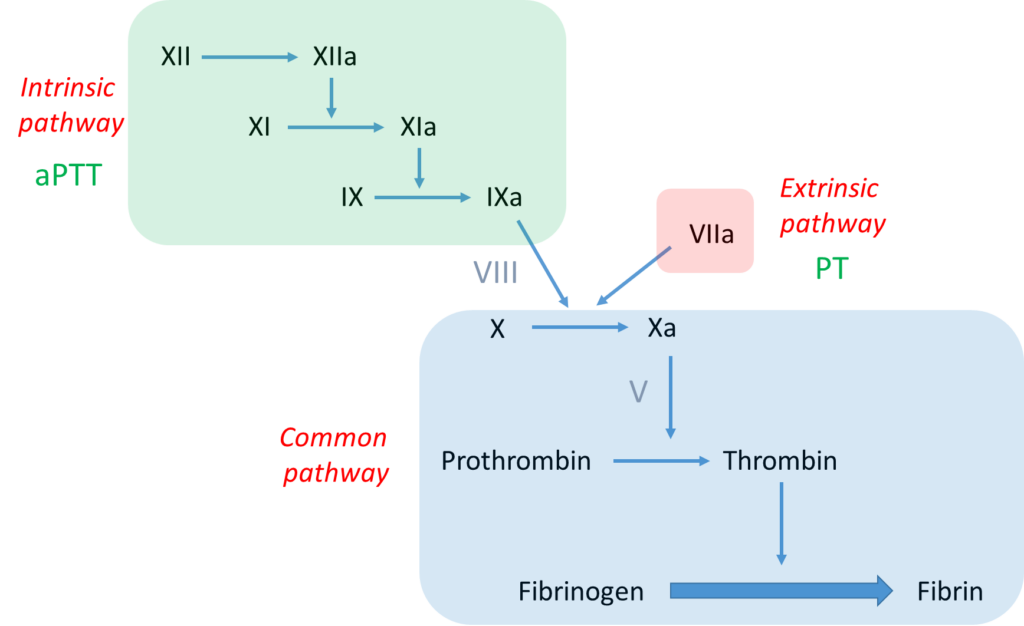
Notes:
- The bottom line is formation of an insoluble fibrin plug, which, along with platelets, stems blood loss.
- Fibrin is derived from thrombin-mediated cleavage of soluble fibrinogen (which is a structural protein).
- Thrombin (which is a type of enzyme called a serine protease) is formed when another serine protease, activated factor X (FXa), cleaves prothrombin.
- Two pathways may activate factor X:
- The intrinsic pathway, which consists of a series of linked reactions involving serine proteases FXII, FXI and FIX, and cofactor FVIII.
- The extrinsic pathway, which consists of tissue factor-mediated activation of FVII (FVIIa).
- In vivo, the clotting cascade is always initiated by tissue factor activation of FVII (extrinsic pathway) and amplified by the intrinsic pathway via cross-talk (FVIIa activates FIX) and feedback (thrombin activates FXI and FVIII) mechanisms.
- aPTT measures the integrity of the intrinsic pathway.
- PT/INR measures the integrity of the extrinsic pathway.

According to the scheme above, elevation in both the PT and aPTT indicates a deficiency of or inhibitor against a clotting factor in the common pathway or multiple factors in the intrinsic and extrinsic pathway.
The patient is not taking heparin or warfarin, two medications that might increase both the PT and aPTT (though heparin has a greater [often sole] effect on the aPTT, and warfarin on the PT).
Let’s review the basics of the mixing study:

Notes:
- Mixing study involves mixing patient plasma and pooled normal plasma in 1:1 ratio.
- The resulting mixture is then processed for clotting time (PT or aPTT) immediately (time 0) and then after 2 hours of incubation.
- A clotting factor must drop below about 30% before the PT or PTT begins to prolong.
- Therefore, even if a clotting factor is completely missing (i.e. 0% level), the 1:1 mix will restore it to 50% (equal volume of plasma containing 0% of the factor and normal pooled plasma containing 100% of the factor), more than enough to restore a normal PT or aPTT (the example above shows 10% activity of imaginary factor Y in patient plasma, with 1:1 mix resulting in 60% activity).
- However, if there is an inhibitor or antibody to a clotting factor, the inhibitor will carry over from patient to normal plasma in the mix and interfere with factor activity, leading to continued prolongation of the PT or aPTT.
Mixing study (50:50 mix) results
(baseline PT 33, aPTT 121.6)
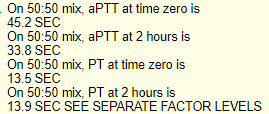
What is the result of the above mixing study?
To summarize at this point, we have a patient with a large thigh muscle hematoma and prolonged PT and aPTT that correct with addition of normal plasma (a negative inhibitor screen or normal mixing study). These results indicate deficiency of one or more clotting factors rather than an inhibitor against a clotting factor.
The results of the factor assays are shown next:
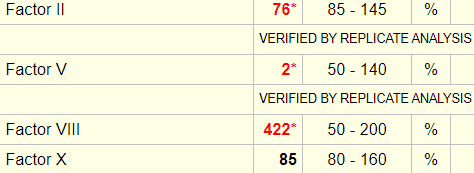
The results of the factor assays are shown next:
What is the most likely explanation for the elevated factor VIII (FVIII)?
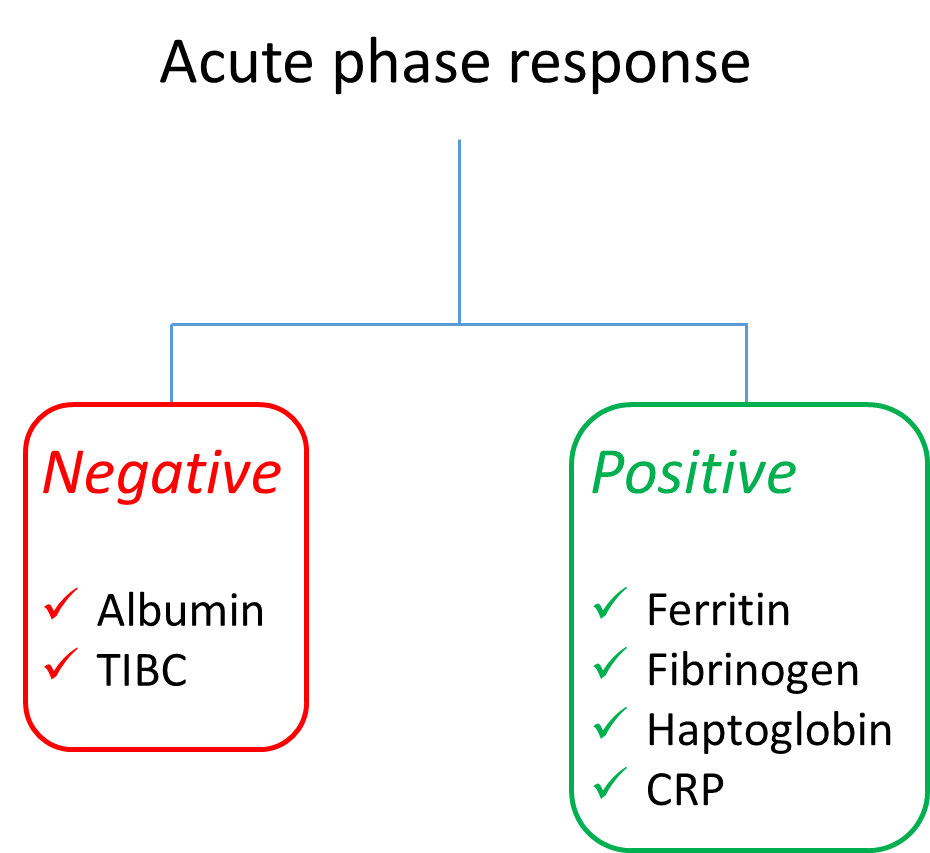
Lab results (CRP not available):
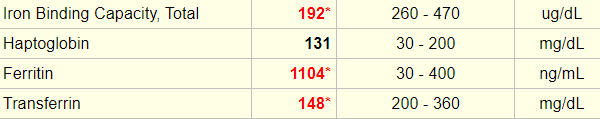


The acute phase response is a multisystem reaction to injury, infection, and other inflammatory triggers. It involves the liver, vascular system, bone narrow and central nervous system. An acute phase protein is one that is typically produced in the liver as part of the acute phase response whose plasma concentration changes from baseline by at least 25% during inflammation.
Acquired deficiency of factor V (FV) is extraordinarily rare. It may occur in amyloidosis. Far more common is an inhibitor against FV, which may be associated with underlying medical conditions such as plasma cell dyscrasia, or exposure to medication or bovine thrombin. A serum protein electrophoresis (SPEP), serum free light chain levels and urine protein electrophoresis (UPEP) were all normal in this patient, arguing against a diagnosis of amyloidosis or a plasma cell dyscrasia. Below is a summary of the lab results arguing against a secondary cause of low FV activity.
| FV deficiency vs. inhibitor | Cause | Lab results |
|---|---|---|
| Deficiency | Amyloidosis | SPEP, UPEP, SLC negative |
| Inhibitor | Drugs mainly beta-lactams — including third-generation cephalosporin and penicillin | Not taking antibiotics |
| Inhibitor | Plasma cell dyscrasia | SPEP, UPEP, SLC negative |
| Inhibitor | Infection | No evidence |
| Inhibitor | Exposure to bovine thrombin | None |
| Inhibitor | Autoimmune disease | No evidence on history; ANA negative |
In summary, given the rarity of acquired FV deficiency, the data are actually more consistent with an inhibitor against FV that does not interfere with FV activity from normal plasma in the mixing study. In fact, it has been shown that in contrast to acquired hemophilia A, anti-FV inhibitors more often result in increased clearance of FV rather than functional neutralization. And it is for that reason that the inhibitor screen (mixing study) is negative (clearance antibodies have no effect in the test tube). That was the working diagnosis in this patient!
Similar cases reported in the literature:
See also Lipshitz et al, 2012; Li et al, 2019.