Labs
Labs (1 of 18 slides)
Labs (3 of 18 slides)
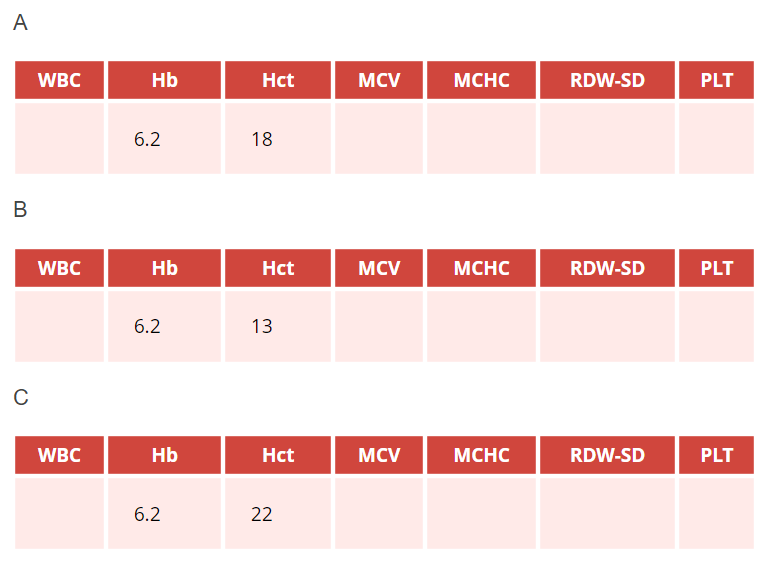
Assuming the patient has iron deficiency anemia, which hemoglobin (Hb g/dL)-hematocrit (Hct, %) pair in the above complete blood counts (CBCs) are you most likely to find?
Which cell best represents the average red cell in this patient? Consider the left most cell to be of normal size with a normal hemoglobin concentration
Labs (7 of 18 slides)
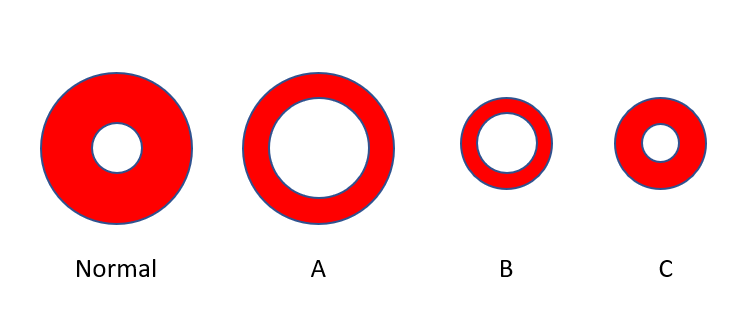
Which cell best represents the average red cell in this patient? Consider the left-most cell to be of normal size with a normal hemoglobin concentration (represented by the ratio of red color to the total red + white [central pallor] color).
Let’s look at another schematic of red cells, only this time a population of cells; which population most closely represented that of our patient’s? Note the normal red cell at top?
Labs (8 of 18 slides)
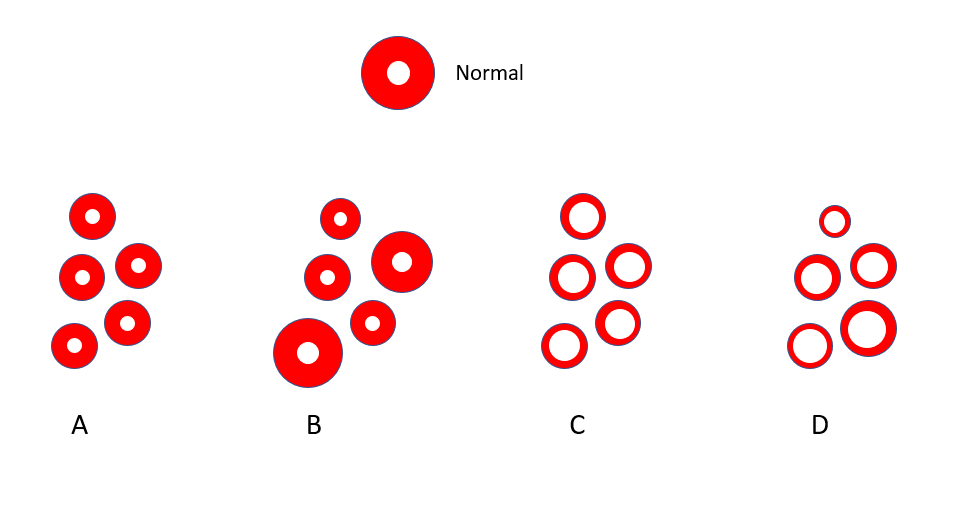
Let’s look at another schematic of red cells, only this time a population of cells; which population most closely represents that of our patient? Note the normal red cell at top.
Labs (10 of 18 slides)
Because the mean corpuscular hemoglobin (MCH), with few exceptions, is not helpful!
The MCH is the mean weight of red cells in hemoglobin. Imagine if we were to take a single red cell, lyse it, and collect all its hemoglobin on a weighing scale. The weight, when averaged across multiple red cells, is the MCH. The MCH is reported in picograms. A normal MCH ranges from 27 to 31 pg.
Labs (11 of 18 slides)
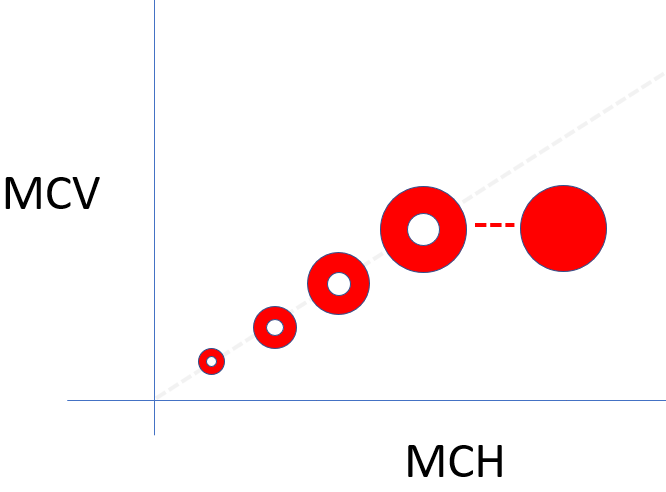
There are two ways to change the MCH: by changing the red cell volume or by changing the MCHC. These relationships are shown in the following schematic. The MCH (x-axis) increases as the MCV (y-axis) increases, and as the MCHC increases (dotted line). In other words, MCH tracks with the MCV and MCHC and since we are already considering these latter two values, there is no reason to be concerned with the MCH in daily practice (there are cases when the MCH provides clues about in vitro artifacts of red cell indices, but these are not our concern here).
Labs (13 of 18 slides)
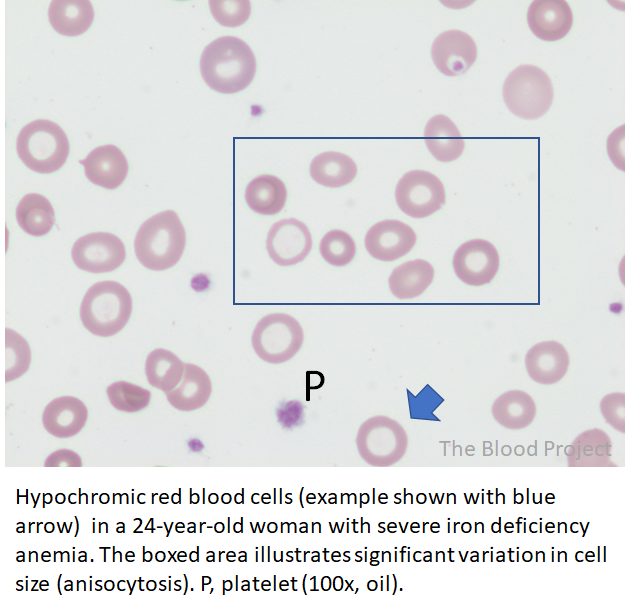
Let’s look at the patient’s peripheral smear:
Which single test would your order to order to confirm or rule out a diagnosis of iron deficiency anemia?
Labs (14 of 18 slides)
Which single test would your order to order to confirm or rule out a diagnosis of iron deficiency anemia?
Notes
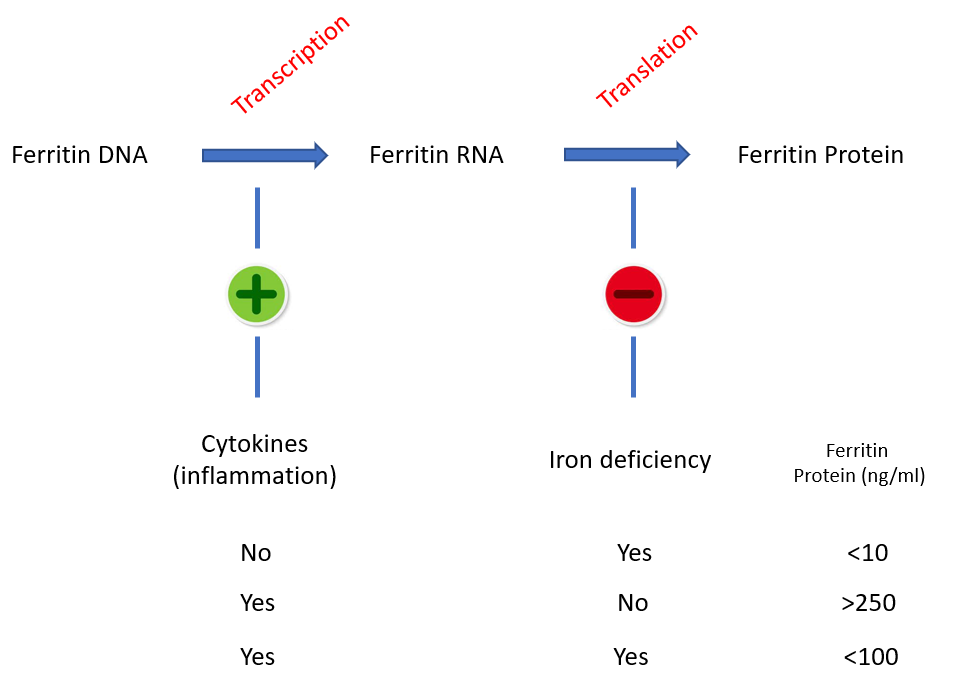
Competing effects of iron and inflammatory cytokines on ferritin expression and serum ferritin levels. Cytokines induce transcription of the ferritin gene (from DNA to mRNA), while iron deficiency blocks its translation (from mRNA to protein). In the absence of iron stores, inflammation – no matter how intense – cannot generally move the “ferritin needle” beyond 100 ng/ml.
Labs (15 of 18 slides)
Lab tests in iron deficiency viewed from pathophysiological angle
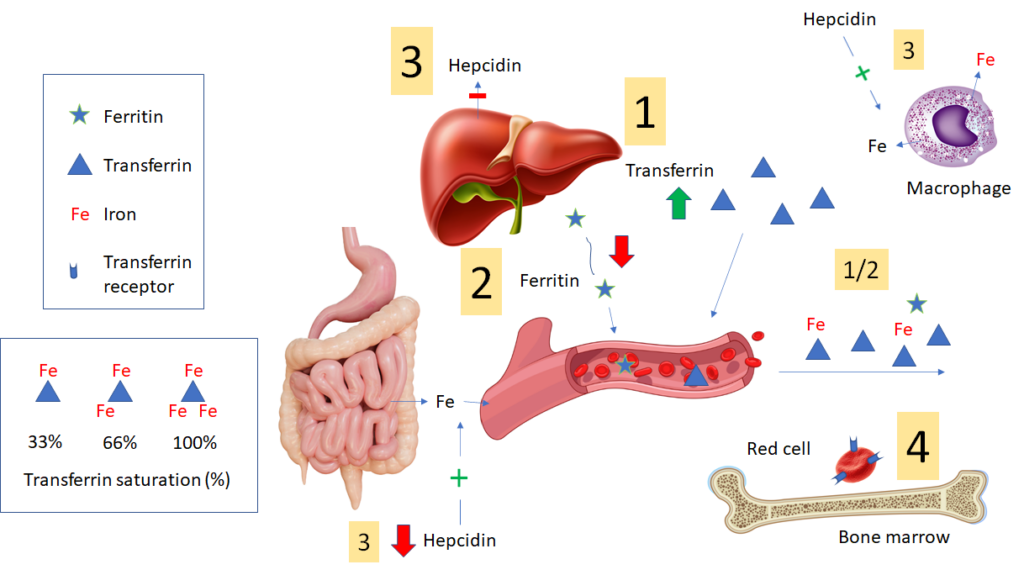
- In iron deficiency, liver expression of transferrin is increased, resulting in increased circulating levels of transferrin, which “mops up” (binds) every last atom of iron (Fe) to deliver to developing erythrocytes in the bone marrow. Transferrin can be directly assayed. However, many labs report the total iron binding capacity (TIBC) as a surrogate marker for the transferrin level. Each transferrin molecule can bind up to 3 iron atoms. The TIBC measures the total amount of iron that the patient’s transferrin can bind. In iron deficiency, because transferrin levels (and TIBC) in blood are high and iron levels are low, the transferrin saturation (TSAT) is low.
- Liver hepatocyte and macrophage expression of ferritin is reduced in iron deficiency (figure shows liver-derived ferritin), leading to lower levels of circulating ferritin. Circulating ferritin has no known function (though it is a very convenient marker of iron stores). However, the reduced levels of intracellular ferritin result in less sequestration and increased availability of iron for transfer to erythroid progenitors in the bone marrow.
- In iron deficiency, the liver expresses less hepcidin. The lower levels of hepcidin (which is not routinely assayed) “open the floodgates” for iron release from cells (especially macrophages) and enterocytes into the blood. These changes serve to maximize the amount of circulating iron.
- Iron-deficiency causes red cell precursors to increase surface expression of transferrin receptors, which can then mediate more intracellular entry of iron.