
What a cost-effectiveness model can tell us, what it cannot, and why the question matters
Iron deficiency is common, often precedes anemia, and is inexpensive to detect. A modeling study asks whether we should start looking for it routinely.
Why this essay matters
Clinical practice routinely screens for hypertension, hyperlipidemia, and several cancers. Yet there is no recommendation in the United States to screen nonpregnant reproductive-age women routinely for iron deficiency.
Instead, ferritin is usually measured only after anemia develops, symptoms prompt investigation, or a clinician identifies a reason to suspect blood loss.
This matters because iron deficiency frequently exists without anemia. A normal hemoglobin does not establish that iron stores are adequate, nor does it exclude clinically important symptoms.
A cost-effectiveness analysis published in the American Journal of Hematology asked a provocative question:1
Would annual ferritin screening of reproductive-age women provide enough health benefit to justify its cost?
The authors concluded that annual testing, followed by treatment when ferritin was below 25 μg/L, would cost approximately $680 for each quality-adjusted life-year gained when oral iron was used.
That is an extraordinarily favorable estimate.
But what does it actually mean?
What exactly was being compared?
The investigators modeled three strategies:
| Strategy | What it means in practice |
|---|---|
| No routine screening | Ferritin is not measured systematically |
| Ferritin threshold of 15 μg/L | Measure ferritin annually and treat when it is below 15 μg/L |
| Ferritin threshold of 25 μg/L | Measure ferritin annually and treat when it is below 25 μg/L |
The phrase “screening at a ferritin threshold of 25 μg/L” is easy to misunderstand.
The threshold does not determine who gets tested. Everyone assigned to a screening strategy undergoes annual testing.
The threshold determines who is diagnosed with iron deficiency and treated after the test is performed.
The modeled intervention was therefore:
Measure ferritin every year from age 18 through age 51, diagnose iron deficiency below the selected threshold, and provide iron replacement.
This distinction matters because changing the cutoff from 15 to 25 μg/L more than doubles the proportion of women identified as iron deficient.
There were no patients in this study
No women were enrolled.
No one underwent ferritin testing because of the study.
No one received iron or was followed prospectively.
This was a computer simulation, specifically a Markov cohort model.
That phrase sounds intimidating, but the basic idea is simple.
The computer imagines a large group of women beginning at age 18. It then advances time in six-month steps. During each step, every simulated woman is placed in one of a few predefined boxes, called health states.
The states included:
- no iron deficiency
- iron deficiency present but undiagnosed
- iron deficiency diagnosed and treated
- treatment discontinued
- death
At the end of each six-month period, the computer asks:
Based on the probabilities entered into the model, how many women stay in the same box, and how many move to another box?
For example:
No iron deficiency
↓
Develops iron deficiency
↓
Annual ferritin test detects it
↓
Begins iron treatment
↓
Either continues treatment
or stops because of adverse effects or personal choice
That is what “moving through health states” means.
No one physically moves anywhere. The computer simply changes the label assigned to a simulated woman as time passes.
Each health state carries:
- an assigned cost
- an assigned quality-of-life value
- a probability of moving to another state during the next cycle
The model repeats this process over many years and totals the projected costs and health outcomes under each screening strategy.
A Markov model is often described as memoryless. What happens during the next cycle depends primarily on the state occupied now, rather than on the full path by which the woman arrived there.
That simplification makes long-term modeling possible. It also compresses complex clinical histories into a small number of boxes.
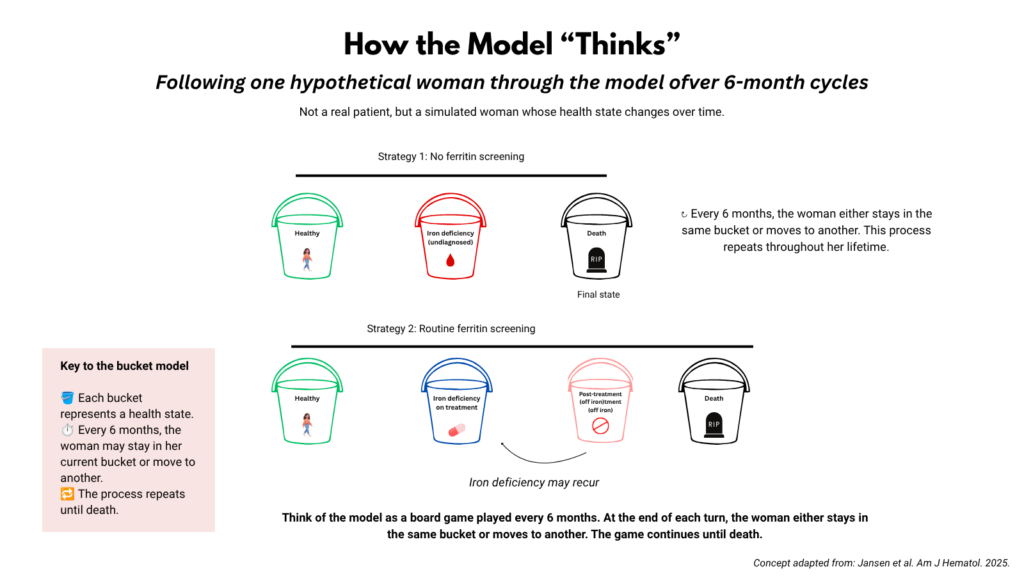
The buckets in the figure represent those modeled health states. At the end of each 6-month cycle, the woman either remains in her current bucket or moves to another according to predefined probabilities.
A woman with ferritin 24 μg/L and no obvious symptoms may occupy the same modeled state as a woman with ferritin 4 μg/L, heavy menstrual bleeding, restless legs, and disabling fatigue.
Real data, simulated women
Although the women were hypothetical, the model inputs came from published sources.
Where did the model get its numbers?
| Model ingredient | Source and modeled value |
|---|---|
| Prevalence of ferritin below 15 μg/L | NHANES-derived estimate: 17% |
| Prevalence of ferritin below 25 μg/L | NHANES-derived estimate: 38.6% |
| Iron deficiency without anemia among women with iron deficiency | 83.6% |
| Ferritin test | CMS fee schedule: $13.63 |
| CBC with differential | CMS fee schedule: $7.77 |
| Six months of alternate-day oral iron | Retail pricing: approximately $66.90 |
| IV iron dextran, 1,000 mg | CMS pricing: approximately $353.38, excluding administration |
| Mortality | Age- and sex-specific U.S. life tables |
| Quality of life associated with iron deficiency | Primarily informed by a prospective Finnish cohort of 236 women with heavy menstrual bleeding, with adjustment for menstrual blood loss and degree of anemia |
| Baseline quality of life | Age-dependent U.S. EQ-5D population norms |
The model therefore assembled information from several different places:
- prevalence from a U.S. population survey
- costs from administrative and pricing sources
- mortality from life tables
- quality of life from a separate clinical cohort
This is the first key principle for reading a modeling study:
Real inputs. Simulated patients. Explicit assumptions.
The output is only as reliable as the inputs and the assumptions connecting them.
How did the model turn iron deficiency into a health benefit?
The prevalence inputs are relatively easy to understand.
NHANES provides estimates of how many reproductive-age women have ferritin values below 15 or 25 μg/L.
But NHANES does not tell the model:
- how many women are fatigued
- how many have restless legs
- how many have difficulty concentrating
- how many have reduced exercise tolerance
- how many have hair loss
- how many feel entirely well
The model did not assign separate probabilities to those symptoms.
It did not say that a certain percentage of women had fatigue, another percentage had restless legs, and another had impaired cognition.
Instead, it replaced the clinical texture of iron deficiency with one average number called a health utility.
The model never asks whether an individual woman is tired. It asks how much health, on average, is lost by occupying the state called “iron deficiency.”
What is a utility?
A utility is a numerical score representing overall health-related quality of life.
Conventionally:
- 1.0 represents full health
- 0 represents death
- values between 0 and 1 represent varying degrees of impaired health
Utility is not binary.
A person does not simply have symptoms or no symptoms. The score is intended to reflect gradations of health.
Someone with mild difficulty performing usual activities might have a utility close to 1. Someone with major limitations, pain, or emotional distress would have a lower value.
Where did the utility values come from?
The authors used information derived from the EQ-5D, a generic questionnaire covering five broad domains:
- mobility
- self-care
- usual activities
- pain or discomfort
- anxiety or depression
Each domain is graded across levels of severity, such as no difficulty, slight difficulty, moderate difficulty, severe difficulty, or inability.
The combination of answers defines a health state. That state is then converted into a utility score using previously developed preference weights.
Those weights are not chosen arbitrarily by the investigators. They come from valuation studies in which members of the general population are asked to compare different health states and make tradeoffs between length and quality of life.
The investigators in this ferritin study did not administer the EQ-5D themselves. They imported utility estimates from prior work.
The principal iron-deficiency utility input came from a prospective study of 236 Finnish women with heavy menstrual bleeding.2 The authors adjusted those data for menstrual blood loss and degree of anemia and then adapted them using population reference norms, including age-dependent U.S. EQ-5D values. They also incorporated separate utility penalties for adverse effects of oral and intravenous iron.
But is EQ-5D a good instrument for iron deficiency?
This is a fair concern.
Most women with non-anemic iron deficiency:
- are not immobile
- can care for themselves
- are not necessarily in pain
- may not be clinically anxious or depressed
Their major problems may be:
- fatigue
- reduced stamina
- impaired concentration
- exercise intolerance
- restless legs
- reduced ability to function at their usual level
EQ-5D does not directly ask about most of those symptoms.
Its best chance of capturing them is through the domain of usual activities, and perhaps indirectly through anxiety or depression if symptoms affect mood.
That creates a possible ceiling effect.
A woman may still be able to work, drive, shower, and care for her family, while also feeling profoundly different from her usual self. A generic instrument may record only a slight change, or none at all.
So EQ-5D may underestimate the burden of iron deficiency because it is poorly matched to the symptom pattern.
But there is a concern in the opposite direction.
The utility estimate came from women with heavy menstrual bleeding, a selected clinical population that may be more symptomatic than women identified through universal screening. Heavy menstrual bleeding itself can impair quality of life independently of iron deficiency.
The possible bias could therefore run in either direction:
- the instrument may miss important iron-specific symptoms
- the selected population may have greater overall impairment than the average screen-detected woman
That uncertainty sits near the center of the model.
From utility to QALYs
Utility is the quality part of a quality-adjusted life-year.
A quality-adjusted life-year, or QALY, combines:
- how good someone’s health is
- how long that person lives at that level of health
The simplest formula is:
QALY = utility × time
For example:
| Time lived | Utility | QALYs accumulated |
|---|---|---|
| 1 year | 1.0 | 1.0 |
| 1 year | 0.8 | 0.8 |
| 10 years | 0.8 | 8.0 |
So the model asks:
If women with iron deficiency have, on average, a lower utility, how many years do they spend living at that lower utility?
If treatment raises utility, the difference accumulates over time.
The model therefore creates the following bridge:
Iron deficiency
↓
Lower average utility
↓
Years lived at that utility
↓
Fewer QALYs
Treatment is modeled in the opposite direction:
Iron deficiency identified and treated
↓
Higher average utility
↓
Years lived at that utility
↓
More QALYs
The model did not predict that ferritin screening would prolong life. Age-specific background mortality was applied similarly across the strategies.
The modeled benefit came from living better, not living longer.
Why does an 18-year-old accumulate only 23.6 lifetime QALYs?
The study discounted future costs and health outcomes at 3% per year.
Discounting means that a health benefit occurring decades from now receives slightly less weight than the same benefit occurring today.
This is a standard convention in economic evaluation. It explains why the modeled lifetime QALY total is much lower than the raw number of years a healthy 18-year-old might expect to live.
The reported gain of 0.8 QALY is therefore a discounted lifetime gain, not a simple sum of calendar years.
The result sentence, translated
Compared with no routine screening, annual ferritin screening with treatment below 25 μg/L:
- increased discounted lifetime cost by approximately $540 per woman
- increased discounted lifetime health by approximately 0.8 QALY
- produced an incremental cost-effectiveness ratio of approximately $680 per QALY
What is an ICER?
ICER stands for incremental cost-effectiveness ratio.
It asks:
How much additional money is spent for each additional unit of health gained?
ICER=additional QALYsadditional cost
Using the rounded values:0.8$540=$675 per QALY
The paper reports approximately $680 per QALY because the model calculation used unrounded values.
What does the $540 represent?
It is not the total cost of medical care.
The model projected lifetime healthcare spending of approximately $210,000 per woman in all strategies. The $540 was the additional amount associated with screening, treatment, adverse effects, and downstream care.
What does 0.8 QALY mean?
It is equivalent to approximately 9.6 months lived in perfect health.
It does not mean that screening adds 9.6 months of life.
It means that the accumulated modeled improvement in quality of life has the same numerical value as 9.6 months in full health.
Is $680 per QALY considered good value?
Health economists compare the cost per QALY with a willingness-to-pay threshold.
This means:
The maximum amount a healthcare system is conventionally considered willing to spend to gain one additional quality-adjusted life-year.
In U.S. cost-effectiveness studies, thresholds between approximately $50,000 and $150,000 per QALY are commonly used. A value of $100,000 per QALY is often selected for the primary analysis.
These are conventions, not laws or binding national standards. No single U.S. authority has declared that one QALY is officially worth exactly $100,000.
Against those benchmarks, $680 per QALY is extremely favorable.
Why does the result look so favorable?
Four features work together.
1. Iron deficiency is common
At a threshold of 25 μg/L, the model classifies approximately 38.6% of reproductive-age women as iron deficient.
A health benefit, even a modest one, therefore applies to a large population.
2. The screening test is inexpensive
The modeled cost of ferritin testing was $13.63.
3. Treatment can be inexpensive
The oral-iron base case used approximately $67 for six months of alternate-day ferrous sulfate.
Even the intravenous-iron analysis produced a very favorable result.
4. Small benefits accumulate
A small sustained improvement in utility, applied over many years, can produce a meaningful lifetime QALY gain.
The result is therefore not mysterious:
A cheap test applied to a common, treatable condition can be highly cost-effective even when the average benefit to each individual is modest.
What happened to the 15 μg/L strategy?
The paper did not merely find that screening below 25 μg/L was better than no screening.
It also found that using 25 μg/L was a better economic strategy than using 15 μg/L.
In the oral-iron model:
| Strategy | Discounted lifetime cost | Discounted lifetime QALYs |
|---|---|---|
| No screening | $209,700 | 23.6 |
| Treat below 15 μg/L | $210,200 | 24.0 |
| Treat below 25 μg/L | $210,200 | 24.4 |
The rounded table shows nearly identical lifetime costs for the two screening thresholds, but greater health benefit with the 25 μg/L strategy.
Moving from no screening to the 15 μg/L threshold cost approximately $490 and gained roughly 0.3 to 0.4 QALY.
Moving from the 15 μg/L threshold to 25 μg/L cost only about another $50 while producing approximately another 0.4 QALY.
The implication is sharper than simply saying that 25 μg/L detects more women:
Under the model’s assumptions, the lower threshold is not only less effective. It is poorer value.
How does ferritin screening compare with other screening programs?
The authors compared their result with published cost-effectiveness estimates for several familiar preventive interventions.
| Screening strategy | Published estimated cost per QALY |
|---|---|
| Ferritin screening below 25 μg/L, oral-iron model | $680 |
| Ferritin screening below 25 μg/L, intravenous-iron model | $2,300 |
| Cervical cancer screening | Approximately $10,260 |
| Breast cancer screening | Approximately $12,710 |
| Colorectal cancer screening | Approximately $13,700 |
| Hypertension screening | Approximately $33,800 |
| Cholesterol screening | Approximately $48,500 |
These are not direct head-to-head comparisons.
The studies differ in:
- populations
- model structures
- screening intervals
- cost years
- assumptions
- harms included
- outcomes generated
Cancer screening may avert deaths but can also lead to false-positive results, invasive procedures, overdiagnosis, and treatment-related harms. Ferritin screening generated benefit almost entirely through modeled improvement in quality of life.
The table therefore does not prove that ferritin screening is “better than mammography.”
It shows that, under its assumptions, ferritin screening appears unusually inexpensive relative to the amount of health benefit assigned to it.
Which assumptions mattered most?
One advantage of a mathematical model is that investigators can ask:
What happens if one of our assumptions is wrong?
They do this through sensitivity analysis.
Sensitivity does not mean certainty or uncertainty.
It means:
How much does the final answer change when this input changes?
Imagine changing one ingredient in a recipe at a time.
If the cost of ferritin is increased, does the conclusion change substantially?
If oral iron becomes more expensive, does the result change?
If the assumed quality-of-life difference between iron-deficient and iron-replete women becomes smaller, what happens?
Some inputs had relatively little influence on the conclusion.
These included:
- the price of ferritin
- the cost of oral iron
Other assumptions had much greater influence.
The model was especially affected by:
- the utility assigned to women with iron deficiency
- the utility assigned to women without iron deficiency
- the prevalence of ferritin below 25 μg/L
In plain language:
The conclusion depended much more on how much iron deficiency affects quality of life than on how much the ferritin test costs.
The investigators varied the model inputs over broad ranges. Screening below 25 μg/L remained favored in all 10,000 probabilistic simulations.
That is reassuring, but it does not mean every assumption is correct. It means that the estimated $680 per QALY was so far below conventional cost-effectiveness thresholds that substantial changes were required before the economic conclusion would reverse.
What about the cost of investigating the cause?
A reasonable concern is that screening does not end with a ferritin result.
A diagnosis of iron deficiency may lead to:
- menstrual-history assessment
- gynecologic evaluation
- testing for celiac disease
- gastrointestinal investigation
- repeated laboratory testing
- referrals and procedures
The authors specifically tested this concern.
Using the commonly applied U.S. benchmark of $100,000 per QALY, they estimated that the diagnostic evaluation could cost approximately $34,000 per woman diagnosed with iron deficiency before screening below 25 μg/L would no longer be considered cost-effective.
Put differently, because the modeled screening strategy cost only $680 per QALY, there was a very large economic margin before its cost approached the level conventionally considered poor value.
That is not an argument that every woman should undergo an extensive evaluation. It demonstrates how favorable the base-case economics were.
The more important concern may therefore be whether screening would produce appropriate and proportionate evaluation in practice, not simply whether downstream testing would make the strategy too expensive.
What deserves healthy skepticism?
The prevalence population and quality-of-life population were different
Iron-deficiency prevalence came from U.S. population data.
The principal quality-of-life input came from a selected Finnish cohort of women with heavy menstrual bleeding.
The model links those populations through statistical adjustment and assumption.
Ferritin below 25 μg/L was treated as one health state
A woman with ferritin 24 μg/L and no obvious symptoms is not necessarily equivalent to a woman with ferritin 4 μg/L, heavy menstrual bleeding, restless legs, and disabling fatigue.
Yet both may be assigned the same average iron-deficiency utility.
Approximately 38.6% of women were below 25 μg/L, but only 17% were below 15 μg/L. That means about 21.6% of the modeled population lay between 15 and 25 μg/L.
This intermediate group was larger than the group below 15 μg/L and is precisely the group in which the average symptom burden and treatment benefit may be least certain.
EQ-5D may not fit the disease well
EQ-5D measures mobility, self-care, usual activities, pain, and anxiety or depression.
It does not directly measure:
- fatigue
- cognition
- exercise tolerance
- restless legs
- hair loss
The model therefore relies on a generic instrument that may be insensitive to the symptoms that make iron deficiency clinically important.
Diagnosis was linked to effective treatment
The model incorporated adverse effects and permanent treatment discontinuation, but real life is more complicated.
Some women:
- never start therapy
- cannot tolerate oral iron
- take inadequate treatment
- continue losing iron
- remain deficient
- improve only partially
- have symptoms unrelated to iron status
Screening produces benefit only when detection leads to appropriate and effective treatment.
The screening interval was assumed
The study modeled annual testing from ages 18 to 51.
It did not establish whether screening should occur annually, every few years, once during adolescence, or only in higher-risk groups.
Pregnancy was excluded
Pregnancy is one of the periods of greatest iron demand, but it was not included in the model.
Ferritin assays are not perfectly interchangeable
Commercial ferritin assays show analytic variability. A value of 25 μg/L measured by one assay may not be identical to 25 μg/L measured by another.
This becomes especially relevant when comparing nearby thresholds such as 25 and 30 μg/L.
What does the study establish?
It does not prove that annual ferritin screening should immediately become standard care.
It does not establish:
- the ideal age to begin
- the optimal testing interval
- whether screening should be universal or risk-based
- which women with ferritin between 15 and 25 μg/L benefit from treatment
- how durable that benefit is
- how screening should trigger investigation of the underlying cause
What it does establish is that ferritin screening is economically plausible and deserves prospective evaluation.
Under the model’s assumptions:
- iron deficiency is common
- ferritin testing is inexpensive
- treatment is relatively inexpensive
- untreated iron deficiency lowers quality of life
- successful treatment restores at least part of that loss
If those assumptions are even approximately correct, routine ferritin screening could offer unusually good value.
Clinical synthesis
This modeling study does not settle whether ferritin should become a routine screening test.
It shows that the question is clinically important, economically credible, and ready for prospective study.
The next generation of research should ask:
- What proportion of women identified through screening are symptomatic?
- How does symptom burden vary across ferritin concentrations?
- Does treating screen-detected iron deficiency improve fatigue, function, cognition, restless legs, and overall quality of life?
- How durable is the response?
- What are the consequences of false attribution, overtreatment, and downstream investigation?
- Should screening be universal or targeted?
- What interval provides the best balance between benefit, burden, and cost?
The model tells us what follows if iron deficiency carries a persistent and treatable quality-of-life cost.
A prospective study must determine how often that premise is true.
A hematologist’s perspective
As a hematologist, I find it difficult to approach this question as a neutral abstraction.
I regularly see women with iron deficiency without anemia who report substantial fatigue, restless legs, cold intolerance, reduced exercise tolerance, hair loss, or difficulty concentrating. Many have carried these symptoms for years. Their hemoglobin was normal, so iron status was never questioned, or a low ferritin was noted and set aside.
These patients are often frustrated less by feeling unwell than by having been told repeatedly that their results are normal.
I should be candid about what that experience does and does not establish.
Women who reach a hematology clinic are selected for being symptomatic and for having a clinician who kept looking. They are not the population a universal screening program would identify. My sample is biased in much the same way as the Finnish cohort discussed earlier.
What my experience establishes is that the quality-of-life decrement is real in some women.
It cannot tell me how large the average decrement is across everyone with a ferritin of 24 μg/L.
What it does establish is the failure of anemia-based case finding. A CBC detects iron deficiency only after depletion has progressed far enough to constrain erythropoiesis. Ferritin asks the earlier and more direct question:
Are iron stores depleted?
That is not a modeling assumption. It is physiology.
Which leaves the central puzzle.
Ferritin is inexpensive, widely available, and asks the right question directly. The absence of a screening recommendation reflects a legitimate evidentiary gap: no prospective population-screening trial has demonstrated that finding and treating iron deficiency improves the outcomes women care about.
That is a reason for humility about screening.
It is not a reason to remain satisfied with the current default.
The surprising question is not why ferritin screening might be cost-effective.
It is why we have gone so long without generating the evidence needed to settle the question.
Reflect and Apply
- How representative is the quality-of-life evidence used in the model?
- Should ferritin values of 4 and 24 μg/L occupy the same health state?
- Which patient-reported outcomes should a prospective screening trial measure?
- Should the first trial compare universal screening with targeted screening rather than with no screening?
- What evidence would be sufficient to change your own practice?
Putting this study in context
This analysis appears to be the first formal cost-effectiveness model evaluating routine ferritin screening of reproductive-age women in the United States.
It builds on three established bodies of evidence:
- Iron deficiency is common, particularly in reproductive-age women (NHANES).
- Ferritin thresholds around 25 μg/L appear to better reflect physiologic iron deficiency than the traditional WHO threshold of 15 μg/L.
- Iron deficiency without anemia can impair quality of life, although the magnitude of that impairment remains uncertain.
What is new is the integration of these data into a single economic model asking:
Would annual ferritin screening provide sufficient health benefit to justify its cost?
Because this is the first study of its kind, there are no independent models or prospective screening trials against which its conclusions can yet be compared.
THE STUDY IN PLAIN LANGUAGE
Ferritin is a blood test that estimates the amount of iron stored in the body. Iron stores can become depleted long before anemia appears on a routine blood count. A woman may therefore experience fatigue, cold intolerance, impaired concentration, or other symptoms while her hemoglobin remains normal.
No U.S. guideline currently recommends routine ferritin screening in women of reproductive age. Ferritin is generally checked because a patient has symptoms, anemia, heavy menstrual bleeding, or another recognized risk factor.
The researchers asked a simple question: What would happen if ferritin were measured every year from age 18 through 51, with iron treatment initiated when the result was below 15 or 25 μg/L?
No women were actually screened
This was a computer simulation, not a clinical trial. The investigators created a hypothetical population of women who moved every 6 months among modeled health states such as:
- no iron deficiency
- iron deficiency that remained undiagnosed
- iron deficiency that was identified and treated
- untreated iron deficiency after treatment was permanently discontinued
- death
The numbers placed into the model were drawn from real sources, including national prevalence data, laboratory and treatment costs, U.S. life tables, and a prior study of health-related quality of life. But no woman had her ferritin measured because of this study, received treatment through it, or was followed to determine what actually happened.
What the model found
Compared with no screening, annual screening and treatment using a ferritin threshold of 25 μg/L added approximately $540 to a woman’s discounted lifetime healthcare costs, which totaled about $210,000 in the model. It also generated an estimated gain of 0.8 quality-adjusted life-years, entirely through improved quality of life rather than longer survival. The resulting cost was approximately $680 per QALY gained.
For context, the paper cites an estimated cost of approximately $12,700 per QALY for breast cancer screening. These comparisons do not mean the interventions produce the same kind of benefit; they place different health interventions on a common economic scale.
Why the estimate was so favorable
Iron deficiency is common. A ferritin test costs approximately $13.63, and six months of oral iron was estimated to cost approximately $66.90. A relatively inexpensive test and treatment applied to a common condition can appear highly cost-effective even when the average benefit to each woman is modest.
What the model does not show
The analysis does not establish that annual screening improves symptoms in real-world practice. It does not tell us which women with low ferritin feel unwell, how reliably prescribed treatment restores their iron stores, how much better individual women feel after treatment, or whether annual testing is the ideal interval.
Those questions require prospective studies of real patients.
Suggested Reading
Wang D, et al. Cost-Effectiveness of Ferritin Screening Thresholds for Iron Deficiency in Reproductive-Age Women. Am J Hematol. 2025;100(7):1132-1140.
Weyand AC, et al. Prevalence of Iron Deficiency and Iron-Deficiency Anemia in US Females Aged 12–21 Years. JAMA. 2023.jamanetwork+1
Mei Z, et al. Physiologically Based Serum Ferritin Thresholds for Iron Deficiency. Lancet Haematology. 2021;8(7):e534-e544.thelancet+1
Peuranpää P, et al. Effects of Anemia and Iron Deficiency on Quality of Life in Women With Heavy Menstrual Bleeding. Acta Obstet Gynecol Scand. 2014;93(7):654-660.