What is RDW?
Red cell distribution width (RDW) is a measure of the variation/heterogeneity in red blood cell size (volume). It’s routinely reported as part of a complete blood count (CBC) and is useful in evaluating causes of anemia. A high RDW indicates a wide range of red cell sizes (anisocytosis), often seen when new cells differ in size from older ones, such as in iron deficiency anemia, mixed nutritional deficiencies, or after treatment of anemia.
Clinical use
RDW is designed to detect anisocytosis (variation in cell size). Clinically, RDW is used in conjunction with other red blood cell indices, such as mean corpuscular volume (MCV), to aid in the differential diagnosis of anemia. Elevated RDW is most commonly seen in conditions with mixed populations of erythrocytes due to ineffective erythropoiesis, increased red cell turnover, or recent reticulocytosis, and is associated with conditions such as iron deficiency anemia, hemolytic anemia, and various chronic diseases. It has also been linked to adverse outcomes in cardiovascular, renal, and inflammatory diseases. However, RDW alone is not diagnostic and should be interpreted in the context of other laboratory and clinical findings.
RDW is particularly useful when interpreted alongside:
- MCV: Helps differentiate causes of anemia
- Peripheral smear: Confirms variation in morphology
- Reticulocyte count: Indicates marrow response
Differential diagnosis of elevated RDW
- Iron deficiency anemia: RDW is often elevated early in iron deficiency as new microcytic cells are produced alongside older normocytic cells, increasing size variability. It may also occur early in treatment as new normocytic cells mix with older microcytic cells.
- Megaloblastic anemia (vitamin B12 or folate deficiency): Ineffective erythropoiesis leads to the release of large, variably sized erythrocytes, causing marked anisocytosis and elevated RDW.
- Anemia of chronic inflammation/chronic disease: RDW may be mildly elevated, especially if there is coexistent iron deficiency or other nutritional deficiencies.
- Hemolytic anemia: Increased reticulocytosis (larger, immature red cells) in response to hemolysis increases RDW.
- Mixed nutritional deficiencies (e.g., iron plus B12): The coexistence of microcytic and macrocytic populations further increases RDW.
- Recent blood transfusion or reticulocytosis: Introduction of donor cells (where donor cells are different in size from the recipient’s cells) or increased endogenous reticulocytes can transiently increase RDW.
- Chronic liver disease or alcohol-related anemia: These conditions can cause macrocytosis and variable red cell morphology, elevating RDW.
- Thrombotic microangiopathy (TTP/HUS/DIC): Microangiopathic hemolysis produces schistocytes and reticulocytosis, increasing RDW. Rule out with clinical context, peripheral smear, and ADAMTS13 activity if TTP is suspected.
- Acute massive hemorrhage/acute blood-loss anemia: Reticulocytosis following acute blood loss can transiently increase RDW. Rule out with clinical history and evidence of acute bleeding.
Key Point: Even if the MCV is normal, the RDW may still be increased. This happens when there are two subpopulations of red cells (e.g., microcytic and normocytic, or macrocytic and normocytic), which the average cell size (MCV) alone would miss.

How is the RDW expressed?
There are two ways to express RDW, each with important distinctions:
- RDW-CV (Coefficient of Variation as a percentage):
- Formula: (Standard deviation of RBC volume ÷ MCV) × 100
- Relative measure that is inversely proportional to MCV; in other words, RDW-CV is mathematically influenced by MCV
- Expressed as a percentage
- May appear “falsely elevated” in microcytosis due to low MCV, even when absolute size variation hasn’t changed
- Most commonly reported by laboratories
- RDW-SD (Standard Deviation in fL):
- Absolute/direct measure of the width of the red cell volume distribution curve
- Represents the actual width (in fL) of the red cell size distribution curve (measured at the 20% height level)
- Expressed in femtoliters
- Unaffected by MCV
- More directly reflects true biological variation in cell size
- Reported less frequently but considered more robust in certain clinical contexts
While RDW-CV is useful and widely available, it must be interpreted in context of the MCV. RDW-SD offers a purer measure of anisocytosis, especially helpful in microcytic or macrocytic states where RDW-CV can be misleading.


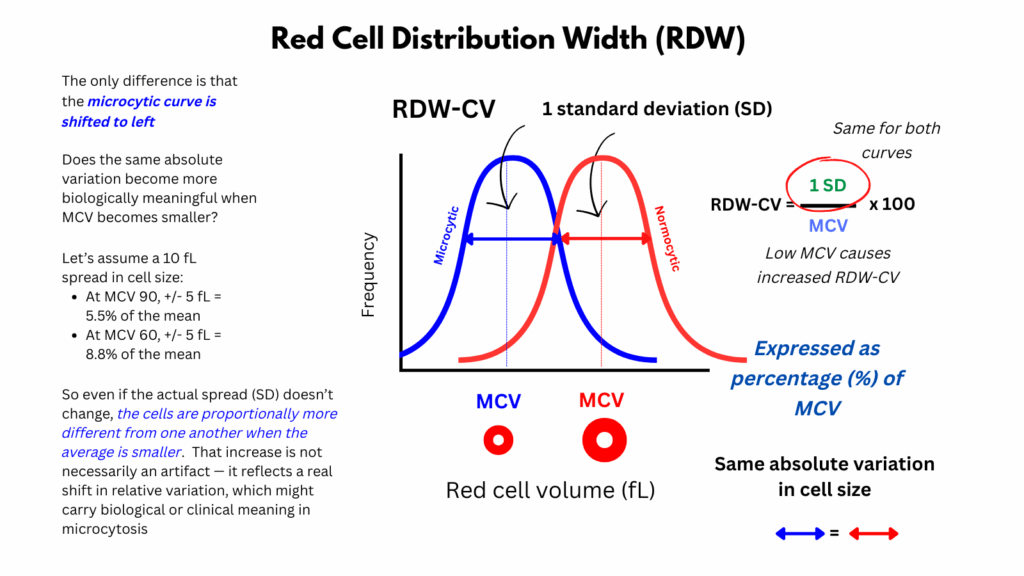
Is the effect of MCV on the RDW-CV an artifact or biologically meaningful?
- Even if the variation in actual cell size (standard deviation) stays the same, RDW-CV will increase if the MCV decreases, because RDW-CV is inversely proportional to MCV:
- Suppose SD stays constant.
- If MCV gets smaller (as in microcytosis), the denominator gets smaller.
- Thus, the RDW-CV increases, even though the absolute variability in cell size (SD) hasn’t changed.
- This means that RDW-CV can increase even when there is no true biological increase in anisocytosis.
- In microcytosis, a high RDW-CV may be mathematically inflated, not biologically meaningful.
- However, even if the absolute variation in cell size (standard deviation or RDW-SD) hasn’t changed, once the average size (MCV) becomes much smaller (i.e., microcytosis), the same absolute variation might become more biologically meaningful — or, put another way, relatively larger compared to the new, smaller mean. So even if the actual spread (SD) doesn’t change, the cells are proportionally more different from one another when the average is smaller.
- Thus, perhaps the increase in RDW-CV as the MCV decreases (when SD is unchanged) is not simply a mathematical artifact, but also a real shift in relative variation that carries biological or clinical meaning in microcytosis. Food for thought!
What about a low RDW?
- The RDW can be numerically low, meaning below the laboratory reference range
- However, this typically just reflects more uniformity and less biological noise/variation in red cell size, and it’s not considered abnormal or diagnostically useful.1
- There’s no known disease state associated with RDW being “too low.”
Conclusion
In summary, the red cell distribution width (RDW) is a simple yet powerful index of the variation in red blood cell size. While it is most often used to help distinguish between different types of anemia, its clinical relevance extends beyond hematology, with elevated values linked to inflammation, nutritional deficiencies, and even outcomes in chronic disease. Interpreted in the right context, the RDW provides an important window into both bone marrow activity and overall patient health.
Infographic
